Download both reports
- RSI(2) Enhanced — full strategy report (PDF)
Short-term mean reversion on QQQ/SPY. Out-of-sample Sharpe 1.04. - Gold Trend (Golden Cross 50/200) — full strategy report (PDF)
Hold gold when the 50-day EMA is above the 200-day. One rule, daily data, decades of history.
Your first email from us is on its way — if it isn't in your inbox within a few minutes, check spam and drag it out so the research reaches you.
Why these two work together
They're deliberately opposite. One buys short-term panic in stock indices; the other rides multi-month gold trends with the classic golden cross — long when the 50-day EMA is above the 200-day, cash otherwise. Monthly correlation between them since 2005: -0.04 — essentially zero, so when one struggles the other usually doesn't care.
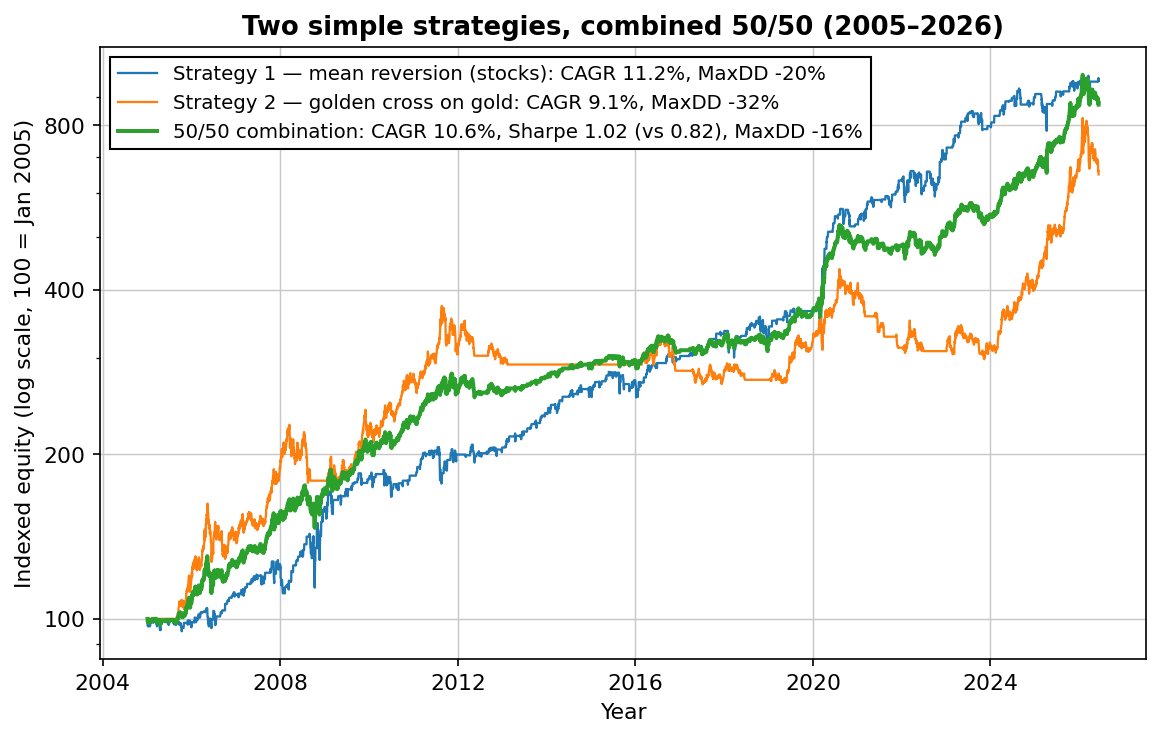
“But Strategy 1 has higher CAGR — why not just trade that?” Because your position size isn't capped by returns — it's capped by the worst drawdown you can survive. Strategy 1 alone turns every $100k into a $20k hole at its worst; the combination caps it at $16k while earning nearly as much. That headroom is spendable: size the combination up 1.25x and you are at roughly 13% a year at Strategy 1's pain level. Same pain budget, more return, calmer ride.
That's the whole argument for trading a portfolio of uncorrelated strategies instead of hunting for one perfect system — and it's why professionals judge everything on risk-adjusted return, not raw CAGR. Portfolio construction is where the real edge compounds; we'll come back to it.
Start here
- The Turnaround Tuesday strategy — rules and 23 years of backtest data
- Why your backtest passes — and your live account doesn't
Questions? Reply to any email from the list — it's me reading, not a support inbox.

Robin Eriksson
Founder of EdgeLab. Five years of discretionary losses taught me to test everything — now I publish the strategies that survive. About me →