Research
Strategies with full rules and out-of-sample backtests, and the methodology behind them. Everything here is reproducible — most articles include the code.
-
How to backtest a trading strategy in Python — and the four mistakes that inflate every result
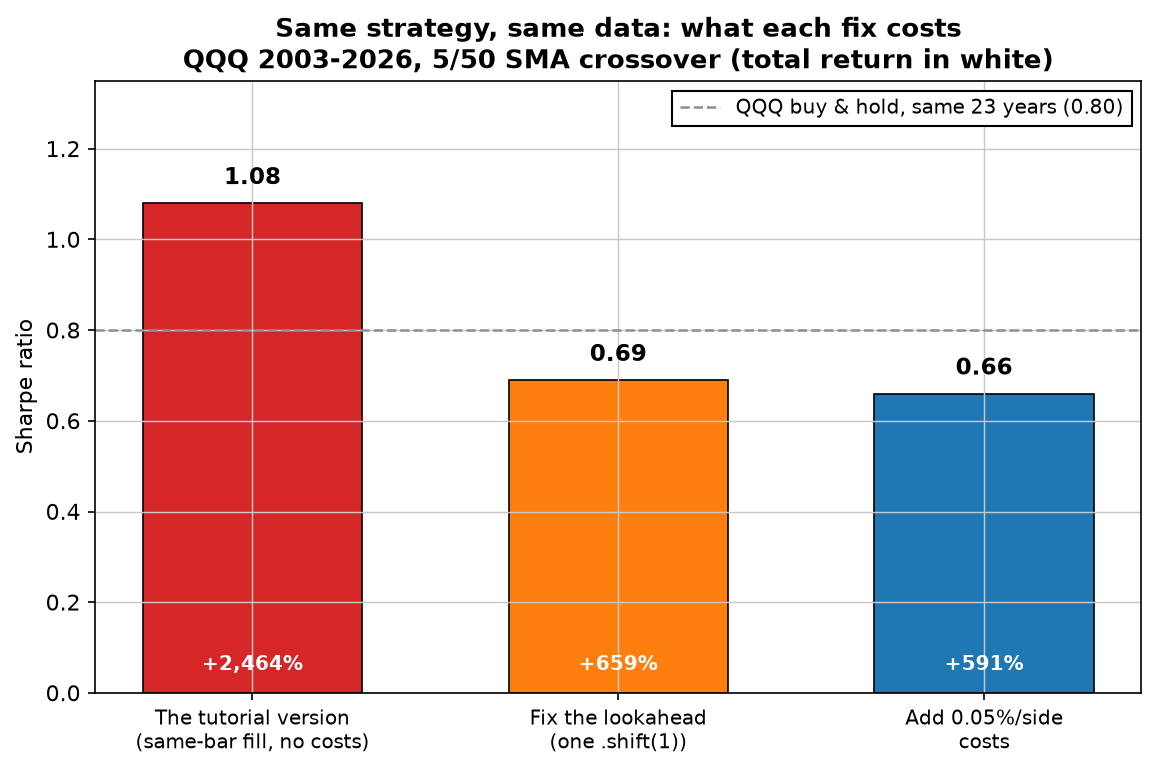
The same SMA crossover, written twice. The tutorial version returns +2,464% on QQQ with a Sharpe of 1.08. Fix the lookahead — one .shift(1) — and it is +659%. Add real costs, choose the parameters on held-back data, and the honest version loses to simply owning the index. Full reusable code, and the tuning step that scored worse than picking at random.
-
Is the opening range breakout dead? We tested it on the Nasdaq
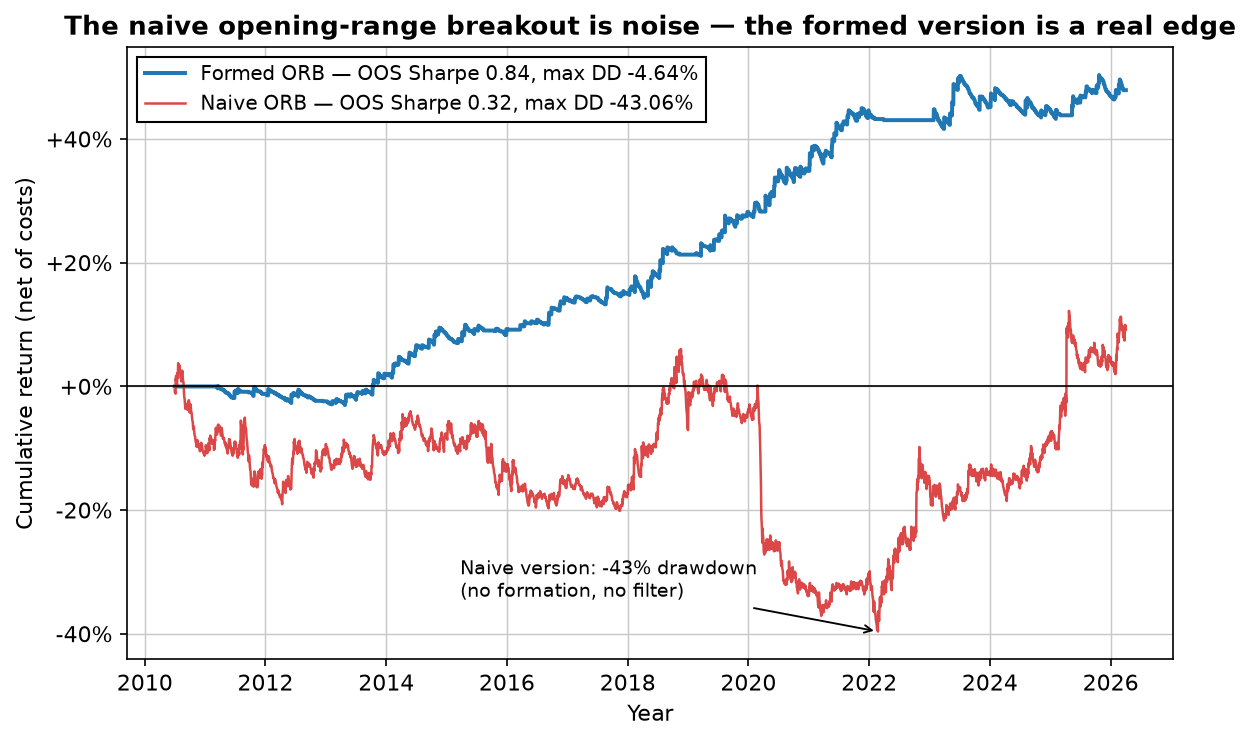
The internet says the opening range breakout is dead. On 16 years of Nasdaq futures data the naive version is — negative in-sample, a -43% drawdown. But trade the direction of the opening move instead, with a trend filter and a tight stop, and the same idea earns an out-of-sample Sharpe of 0.84 with a -4.6% max drawdown. The one difference that flips it.
-
Zarattini's intraday momentum on the Nasdaq: the long side survives, the short side is a mirage
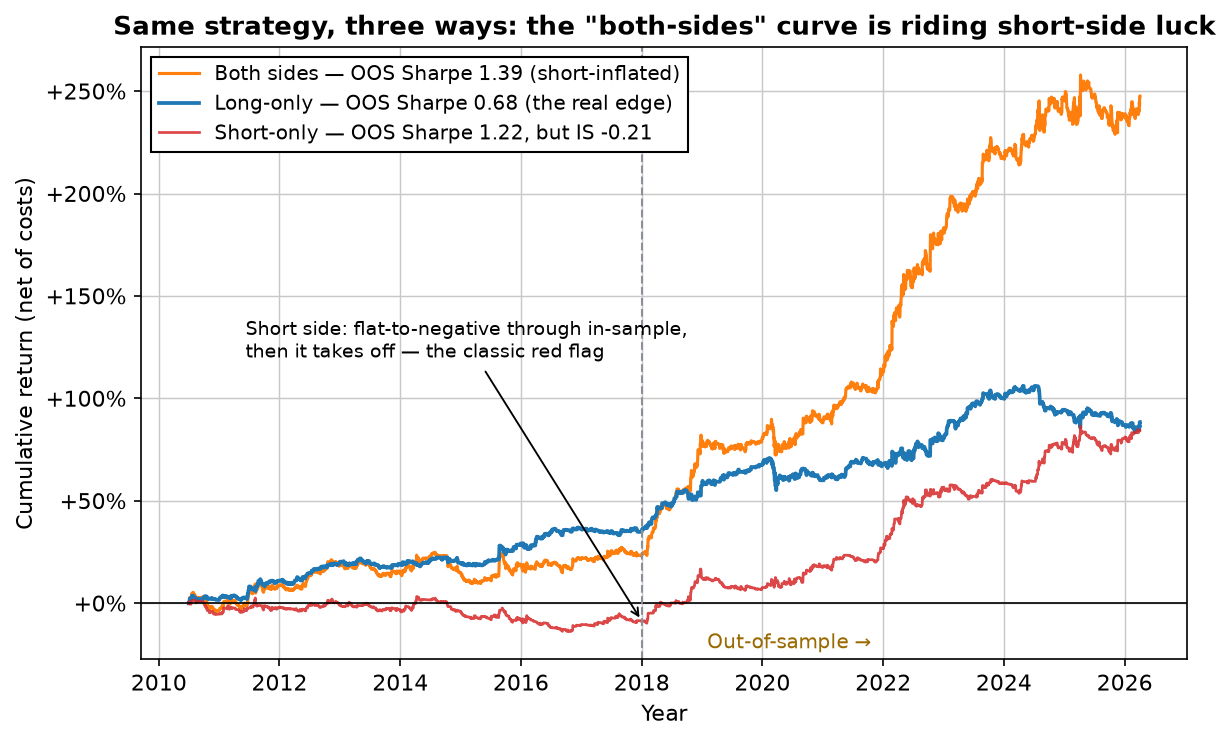
The famous 'Beat the Market' intraday momentum strategy, rebuilt on 16 years of Nasdaq futures and split in two. The long side held up out-of-sample (Sharpe 0.68 business-day, 1.18 per trading day); the short side was negative in-sample and only profitable out-of-sample — regime luck, not an edge. Why the headline 'both-sides' number is a trap.
-
Does Connors' RSI(2) still work? We tested it on the Nasdaq
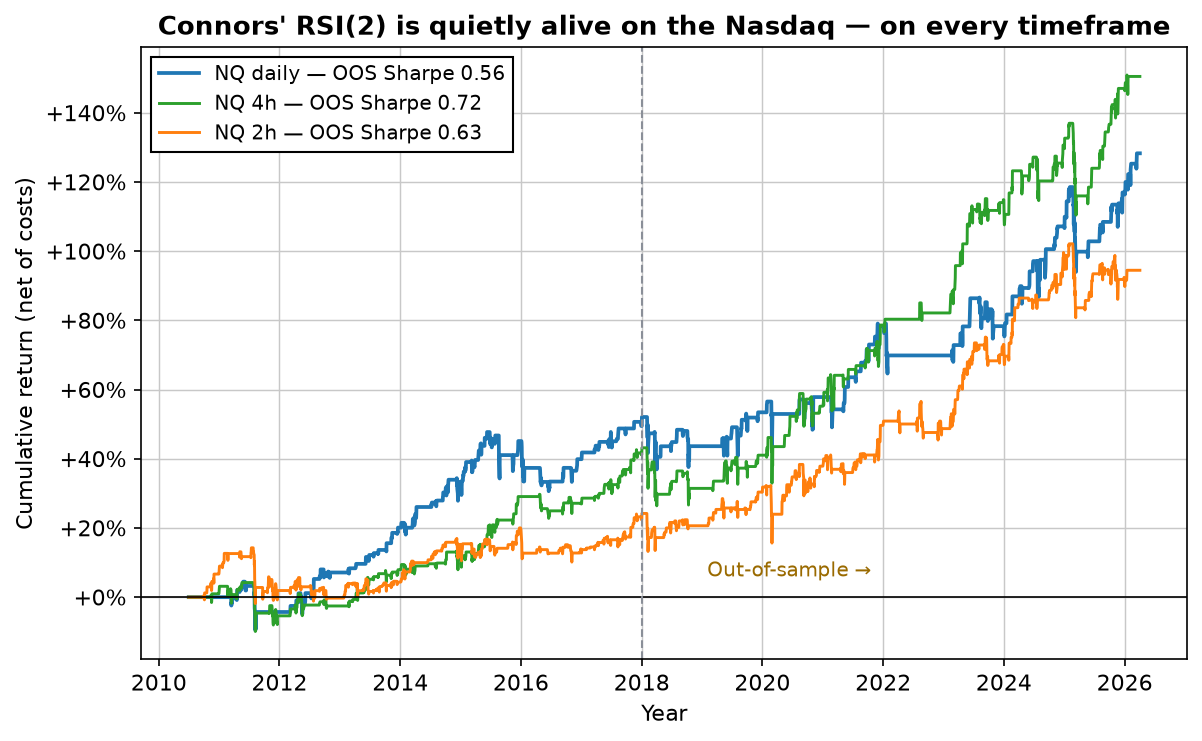
The internet says Connors' 2-period RSI is dead. On 16 years of Nasdaq futures it's quietly alive across daily, 2h and 4h — out-of-sample Sharpe 0.56 to 0.78, net of costs, even the elaborate TPS scale-in. It didn't die; it got crowded — the difference between a strategy that's broken and one everyone already owns.
-
SPY vs QQQ vs gold vs bitcoin: the best asset, risk-adjusted
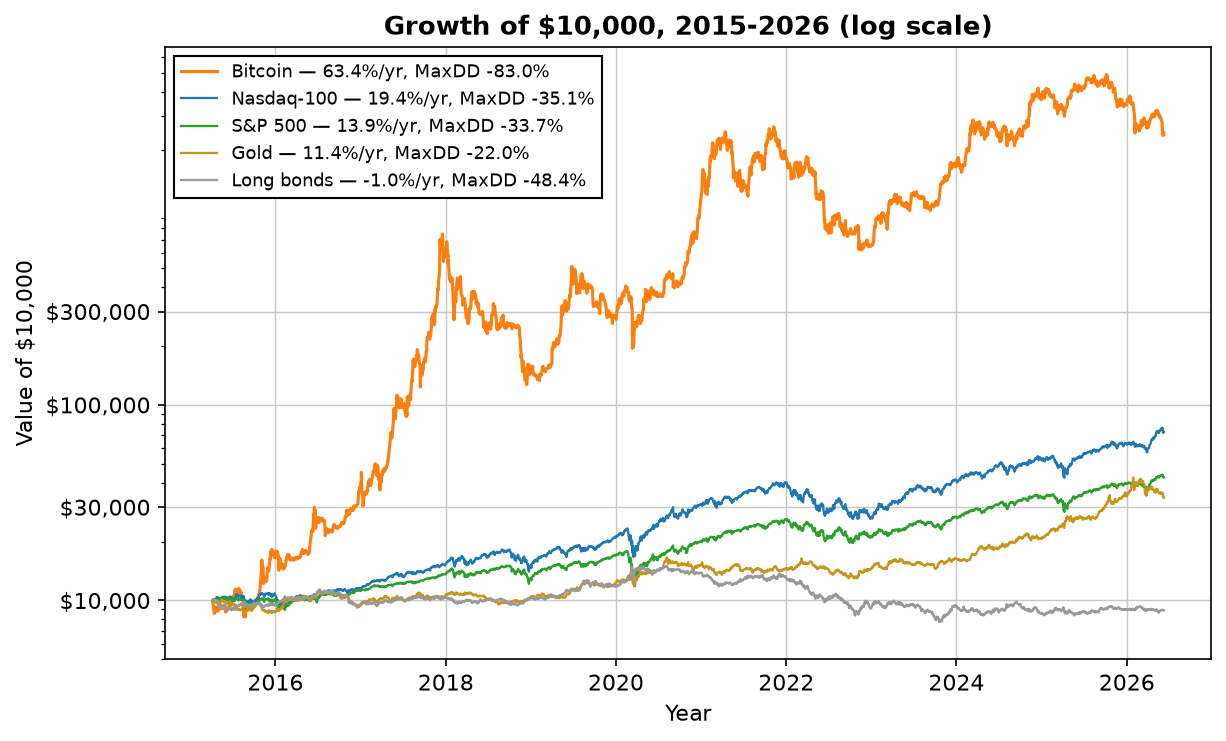
Stocks, gold, bonds and bitcoin over 11 years, ranked honestly. Bitcoin won on raw return — with an -83% drawdown and a -74% year. But an equal-weight mix of all five beat every single one on risk-adjusted return. Why chasing the winner is the wrong lesson.
-
Does the 200-day moving average work? Tested on five assets
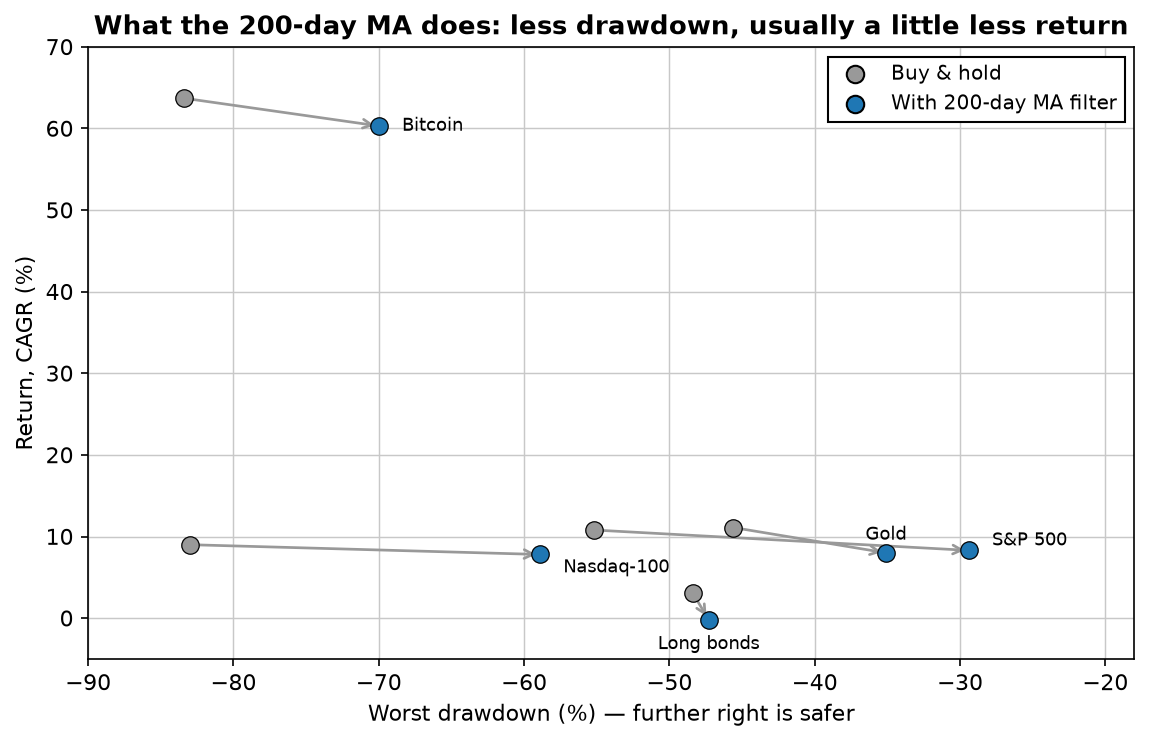
The most-watched line in trading, run as a hold-or-cash filter on stocks, gold, bonds and bitcoin. It roughly halves stock drawdowns and lifts risk-adjusted return — but turns bonds' +3.1% into -0.2%. A drawdown tool, not a return booster, and only where it fits.
-
Does "sell in May and go away" work? 33 years of SPY, tested
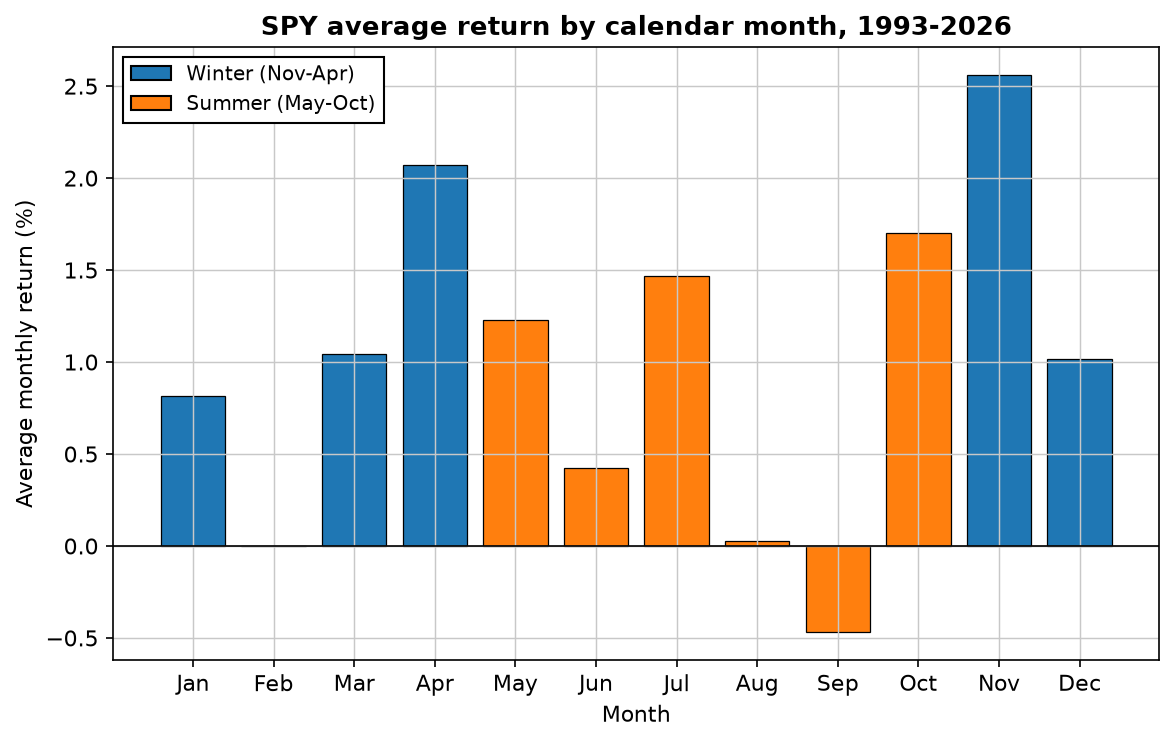
The summer slump is real — over 33 years, winter beat summer in 5 of 6 five-year blocks. But going to cash each May still returned 6.7% a year versus 10.8% for buy-and-hold, with a worse Sharpe. A real pattern that isn't a tradable edge — and the least-bad version.
-
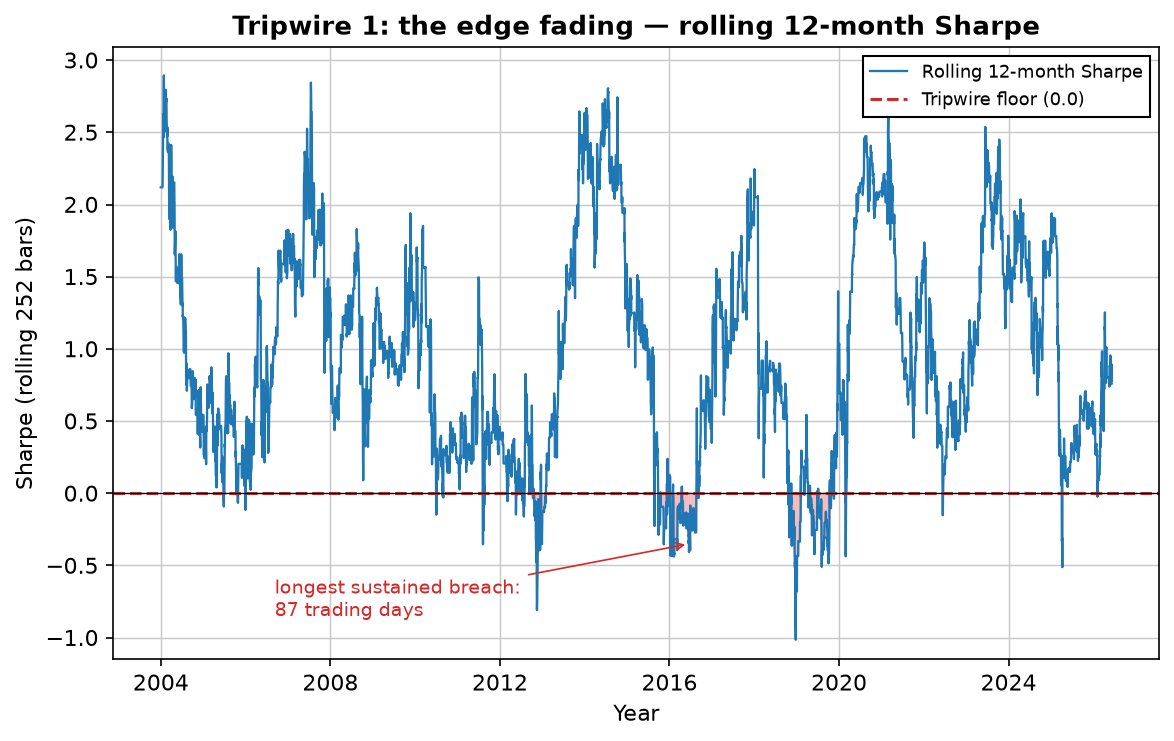
When is a strategy dead? Three statistical tripwires we use
Telling a normal bad patch from a genuinely broken edge — before it drains the account. Three tripwires you pre-commit and check live: a sustained rolling-Sharpe breach, a drawdown past its Monte Carlo envelope, and a shift in the trade distribution. Worked on a real 23-year record.
-
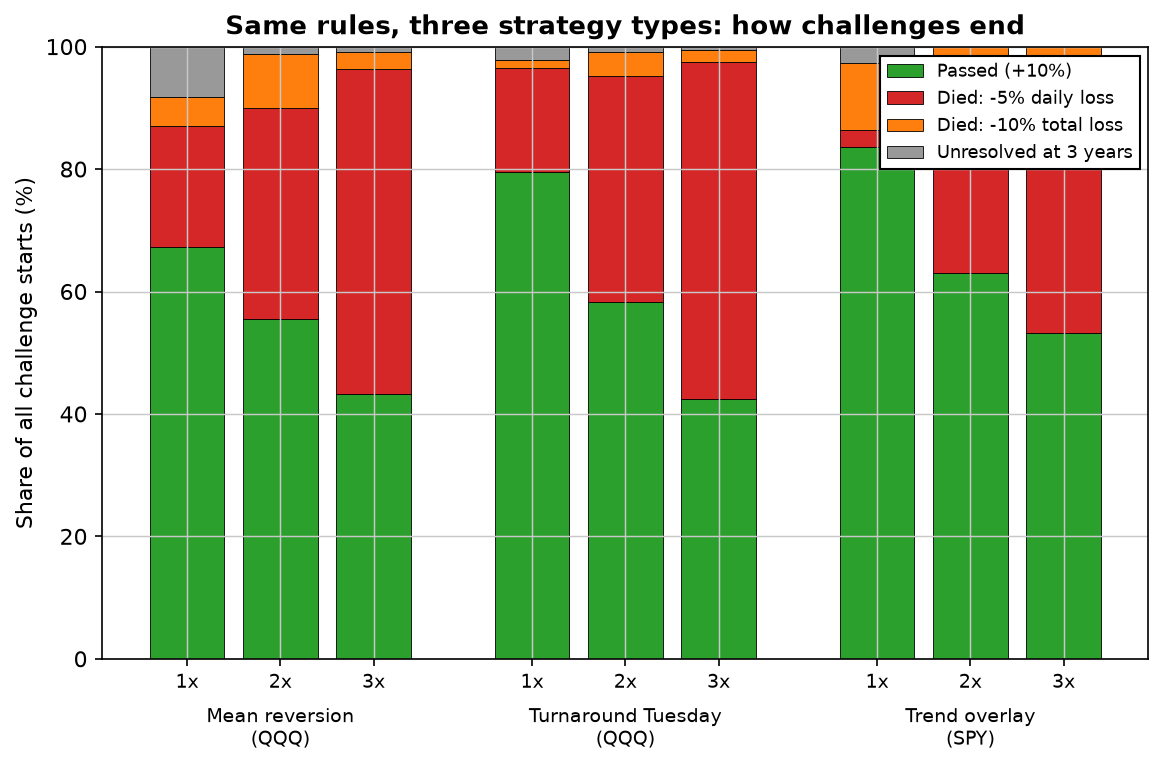
Prop firm math: why the daily loss limit matters more than the profit target
Three strategy types, 23 years, one prop-rule simulator. The profit target is the number everyone watches — the daily loss limit is the one that decides. And the killer isn't even the same across strategies: dip-buyers die fast to the daily rule, trend dies slow to the total rule.
-
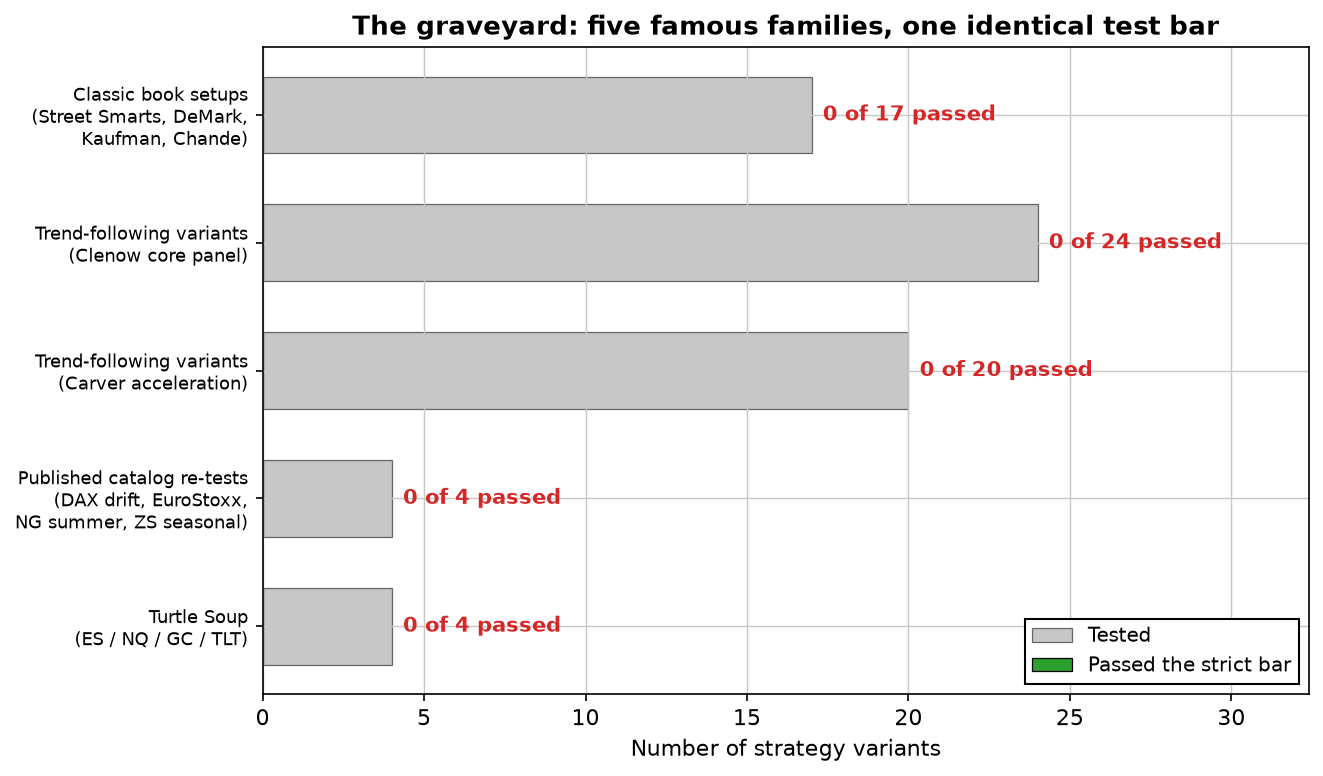
The Strategy Graveyard: we stress-tested 150+ trading strategies — most didn't survive
One identical out-of-sample, walk-forward, real-cost bar. Few strategies cleared it — but most didn't die, they were edges we already owned or that need institutional scale. The honest breakdown, and why a stack of OK uncorrelated strategies beats the hunt for a perfect one.
-
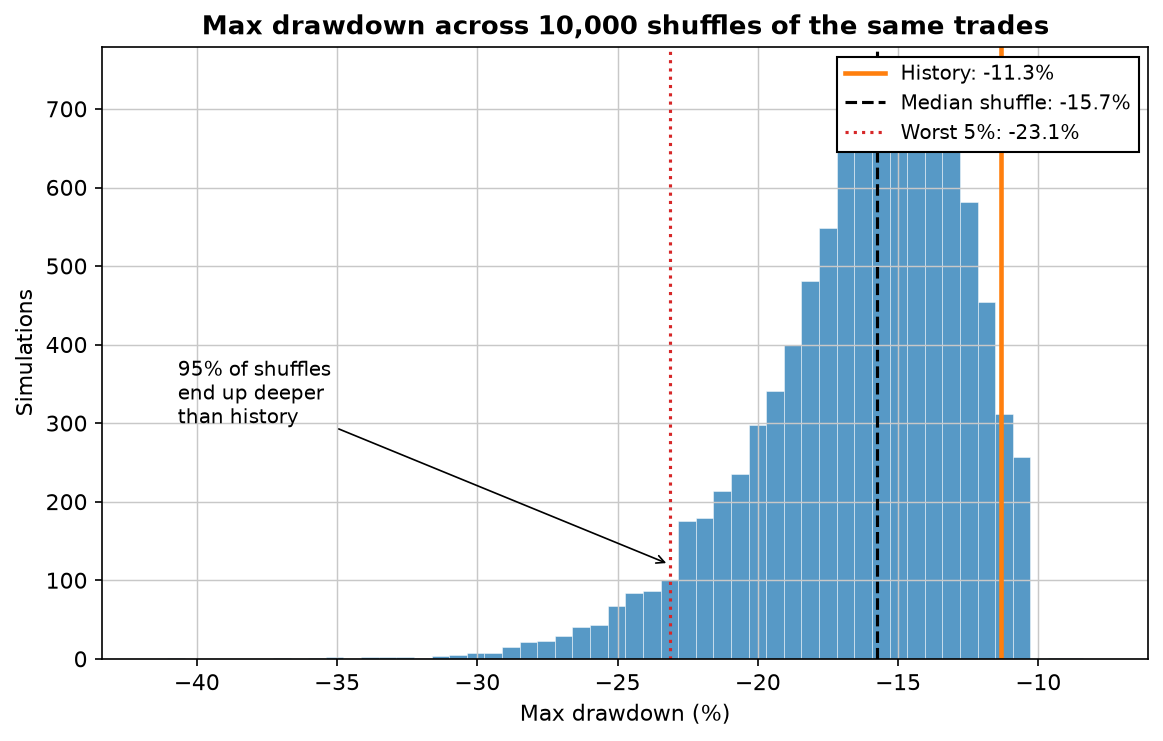
Your worst drawdown is still ahead of you: 10,000 Monte Carlo reshuffles
We shuffled 410 real trades 10,000 times. Same trades, same profit — but history's -11.3% max drawdown turns out to be the lucky draw: 95% of reorderings go deeper, and a new all-time-worst within ten years is more likely than not.
-
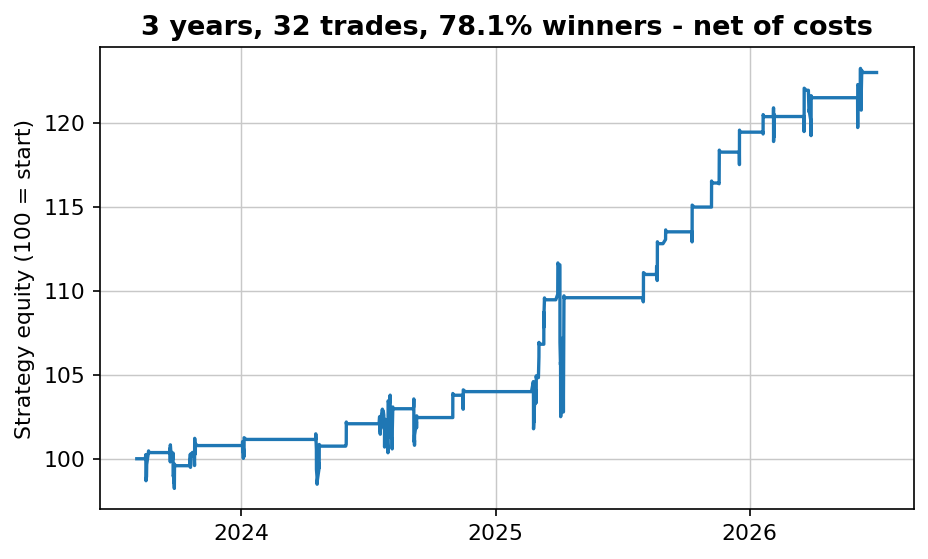
The RSI 30/40 strategy: buy the Nasdaq at 30, sell at 40 — every trade from 23 years
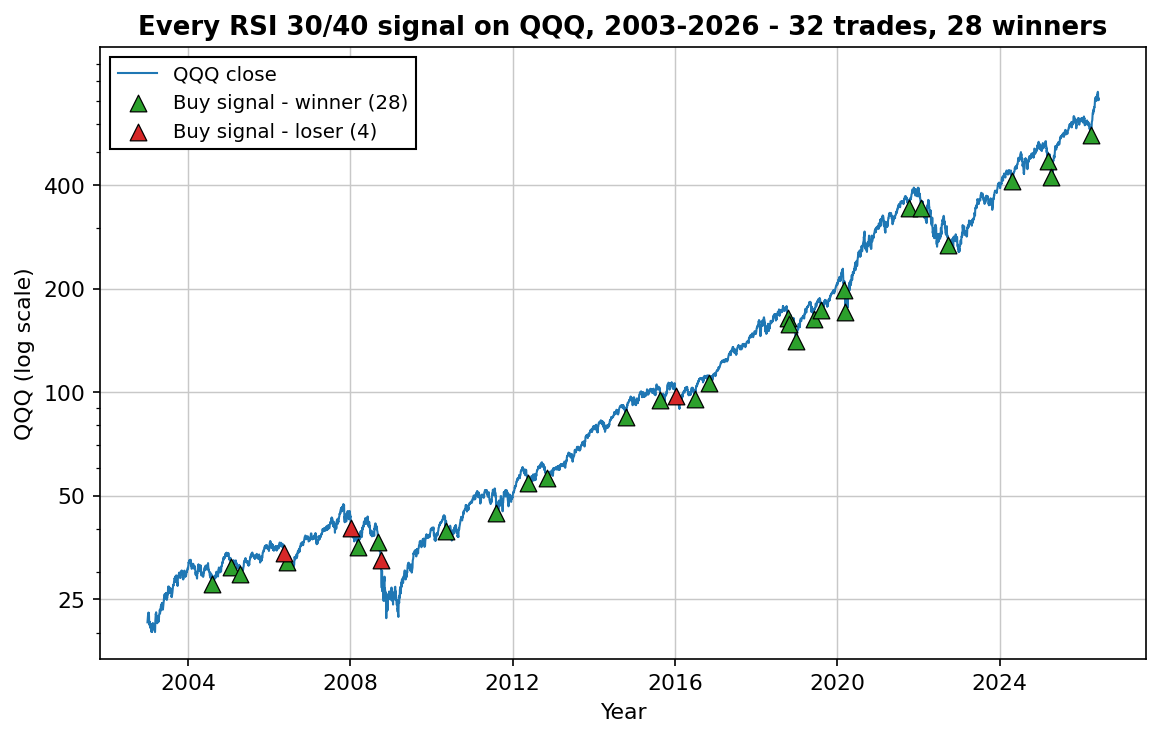
The strategy from the video, tested honestly: 32 signals since 2003, 28 winners, every trade listed one by one — plus the faster RSI(2) variant and the honest math of what each earns.
-
Buying the dip in QQQ: 23 years of evidence, net of costs
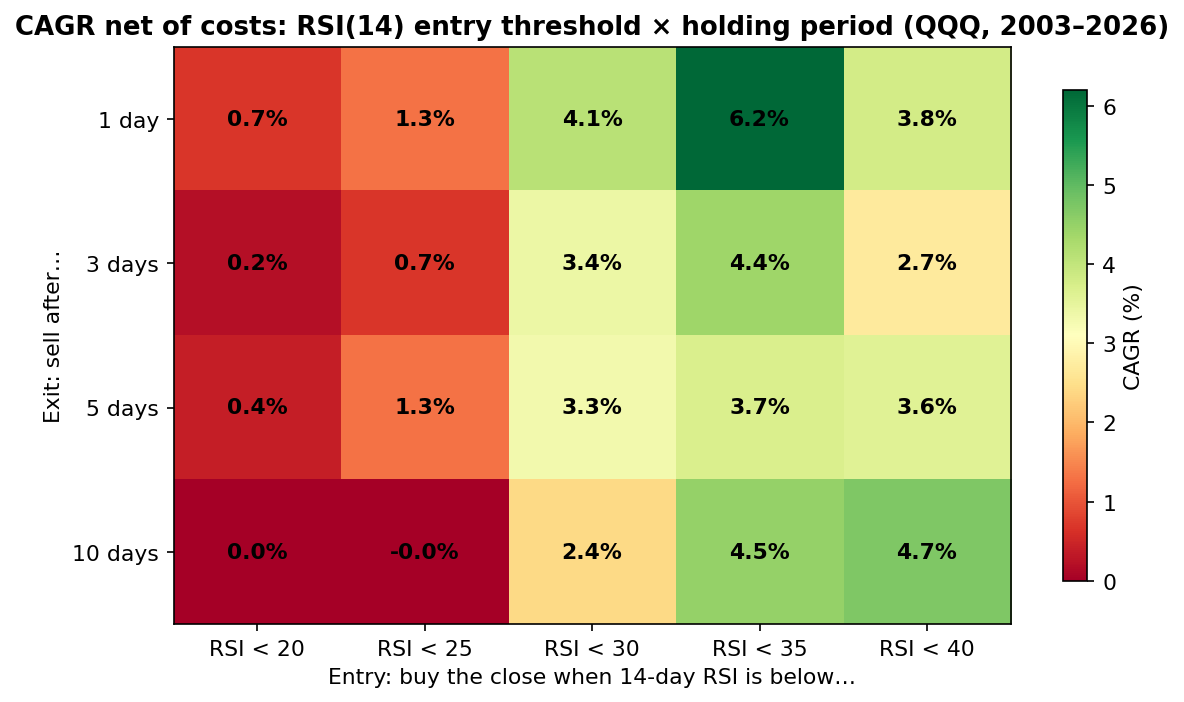
Twenty rule combinations, no cherry-picking: the dip-buying edge is real, robust across settings, and persistent across two decades. It still doesn't do what the meme says it does.
-
How many trading strategies do you need? The portfolio math
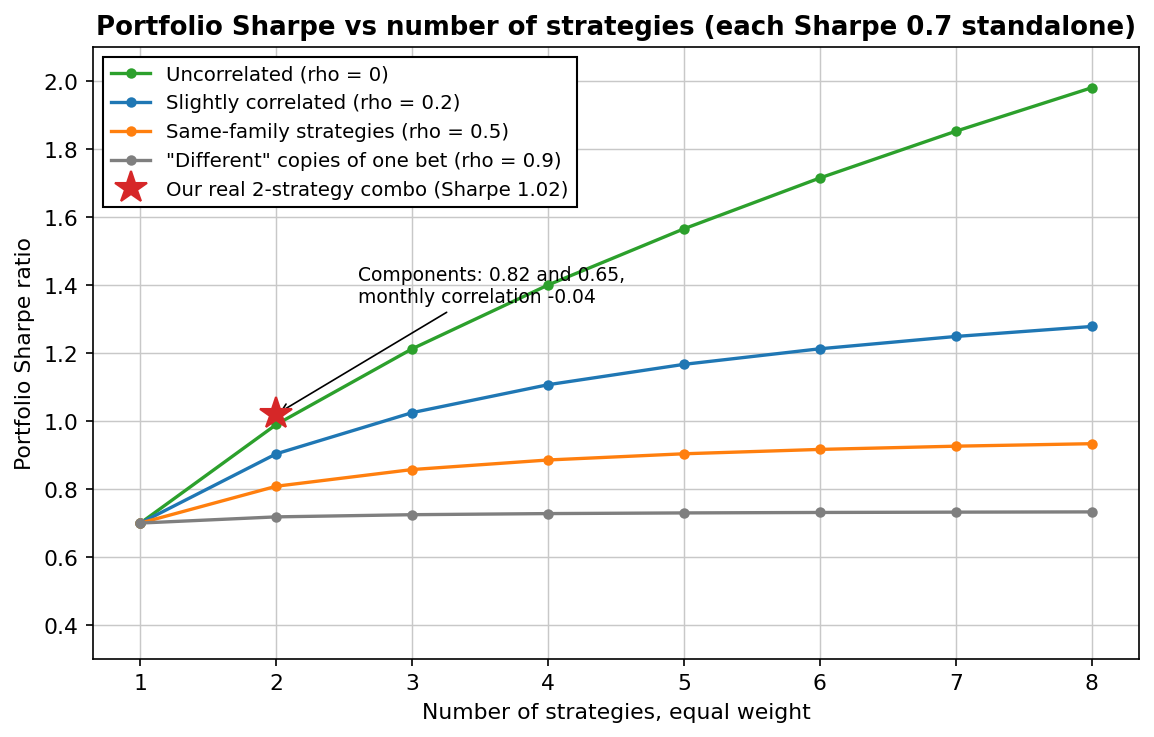
One formula decides it, and correlation is the variable that matters. Theory said our two-strategy combo should land at Sharpe 1.04 — the market paid 1.02. The full math, plus the trap that ruins most multi-strategy portfolios.
-
Can a mechanical strategy pass an FTMO challenge? We ran 5,600 of them
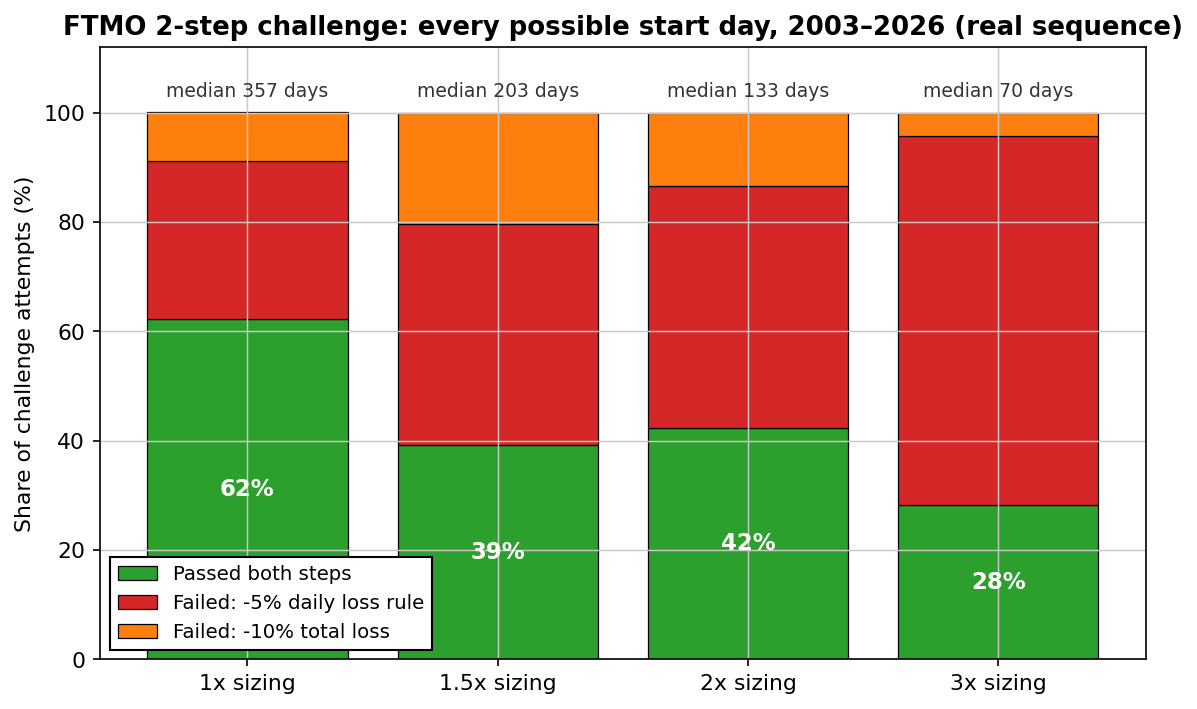
62% pass at honest size — but the median pass took 357 trading days, and sizing up feeds the daily-loss rule. The simulation prop firm content never runs.
-
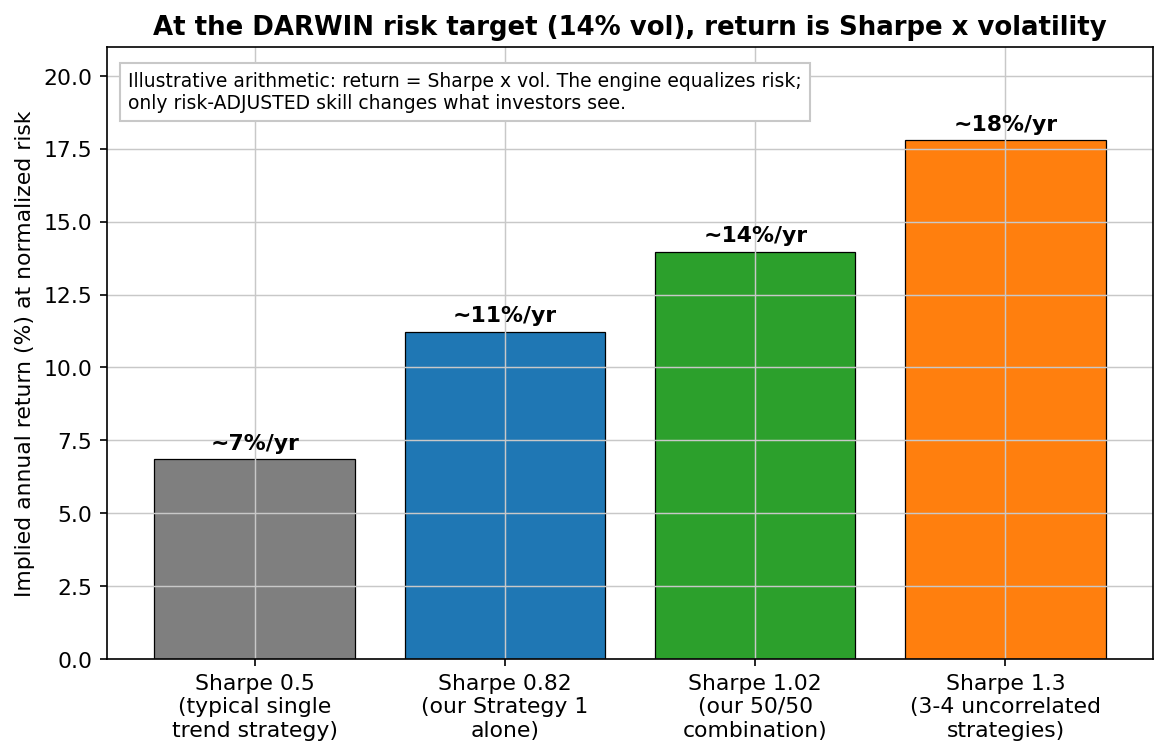
Darwinex Zero for systematic traders: the platform that pays for Sharpe
Not another affiliate review. How the VaR engine turns risk-adjusted return into the only metric, the honest breakeven on €45/month, and who should pick a prop firm instead.
-
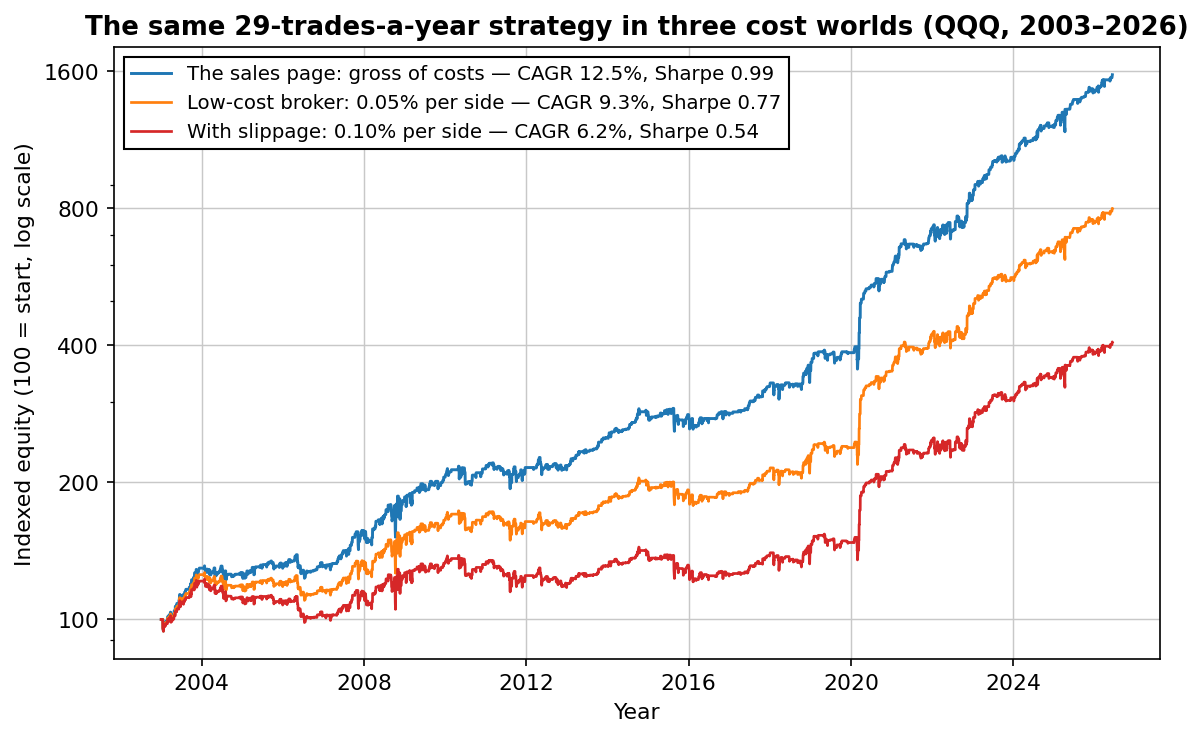
Are paid trading strategies worth it? A buyer's checklist from someone who sells them
Most aren't. A minority are — and the difference is checkable before you pay. Five questions, the red flags that end the conversation, and the chart that explains most bad purchases.
-
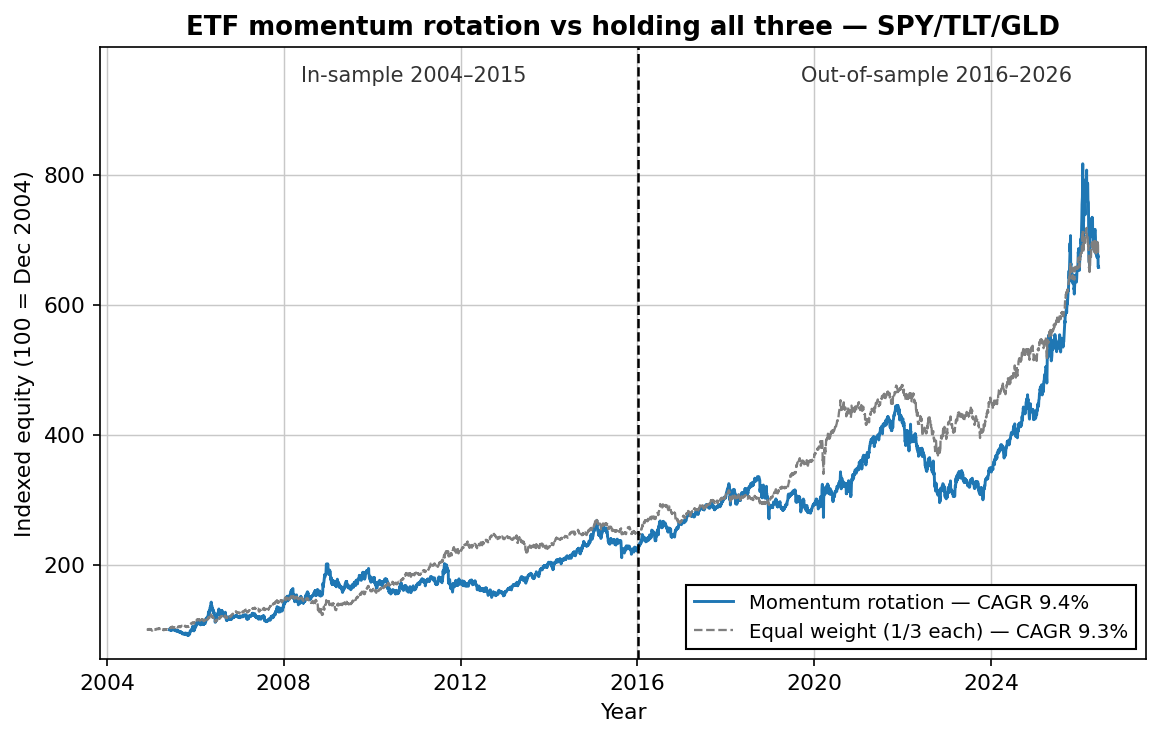
ETF momentum rotation: rules, 21 years of data — and an honest verdict
One decision a month across stocks, bonds and gold. 10.9% CAGR out-of-sample — but the boring benchmark beat it risk-adjusted, and every "improvement" we tested just snuck the portfolio back toward buy-and-hold.
-
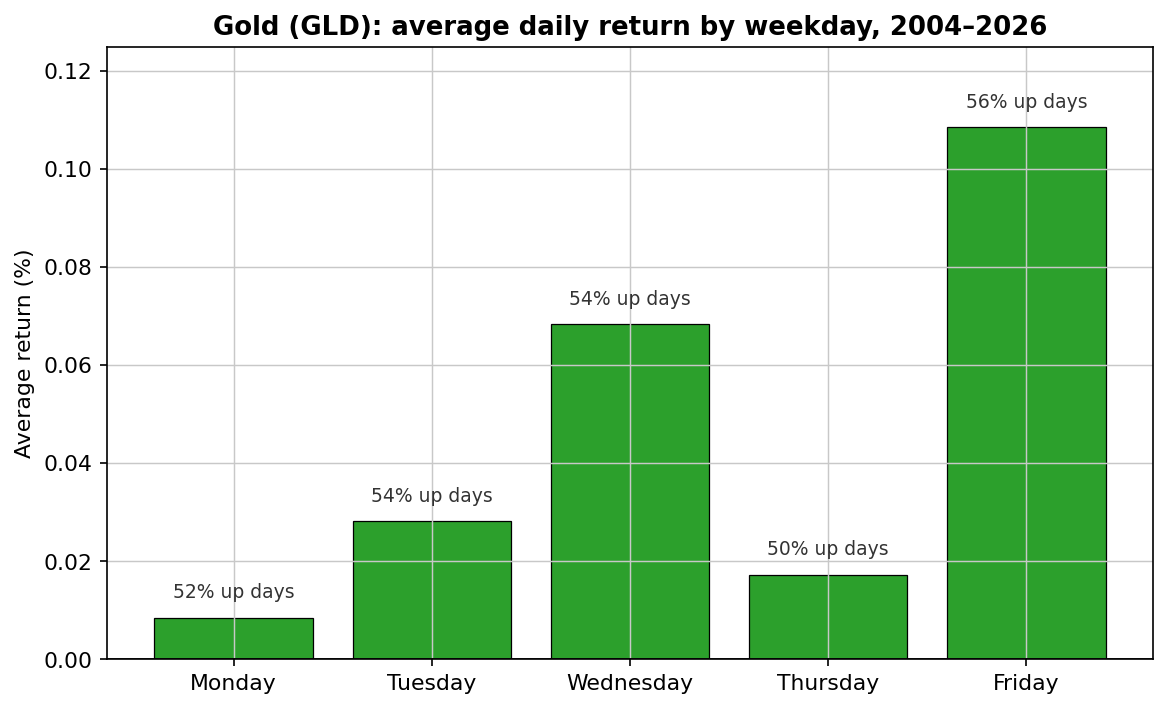
The Friday gold effect: a real pattern you probably can't trade
Friday is 12x better than Monday in gold — half of all daily gains on one weekday. Costs eat the naive version. One VIX-filtered variant survives as a satellite trade — I run it myself, and the exact rules are in the article.
-
The Turnaround Tuesday strategy — rules and 23 years of backtest data
Two rules, no indicators. 81% win rate out-of-sample and under 20% time in the market. Full rules, equity curves, SPY validation — and the honest caveats.
-
Why your backtest passes — and your live account doesn't
We optimized 2,160 parameter combinations to build the perfect backtest, then watched it fall apart on data it had never seen. Out-of-sample testing is the filter that catches it.
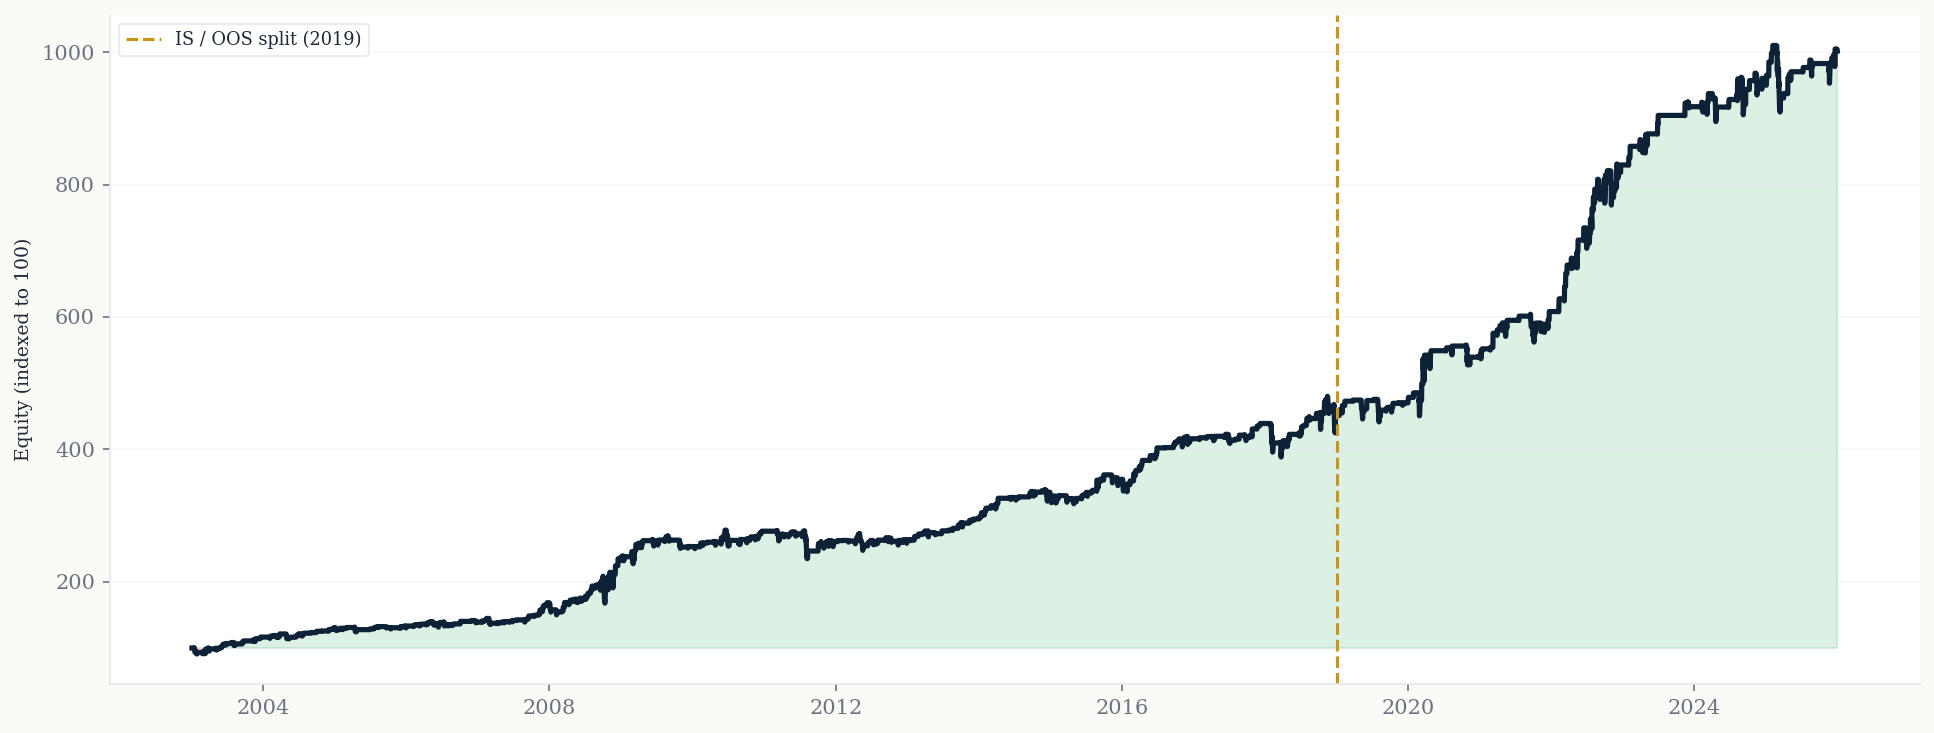
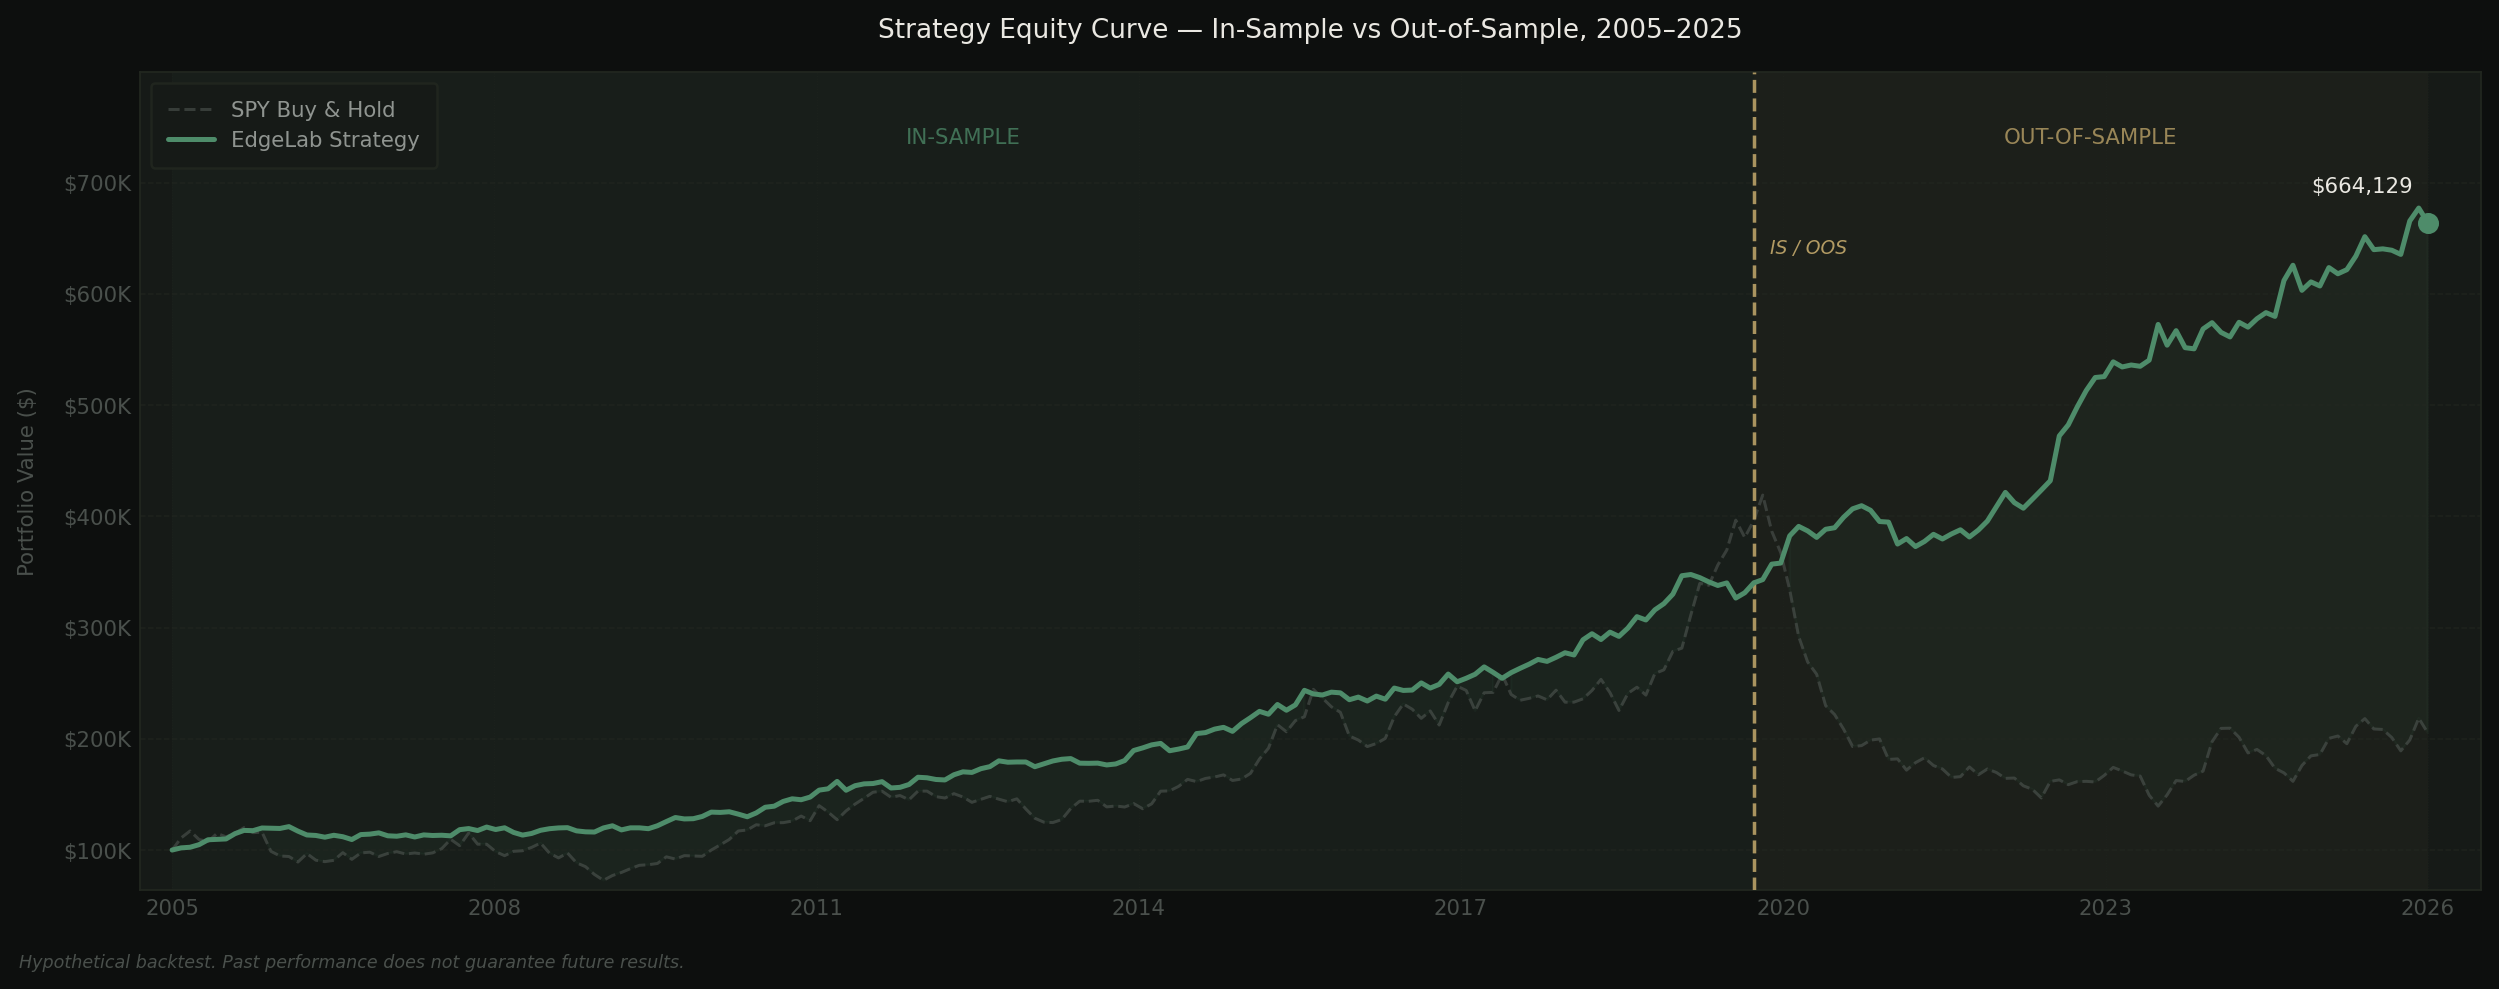
New research is published every week. Join the list to get it by email — plus the free strategy, every trade it has taken shown in full.