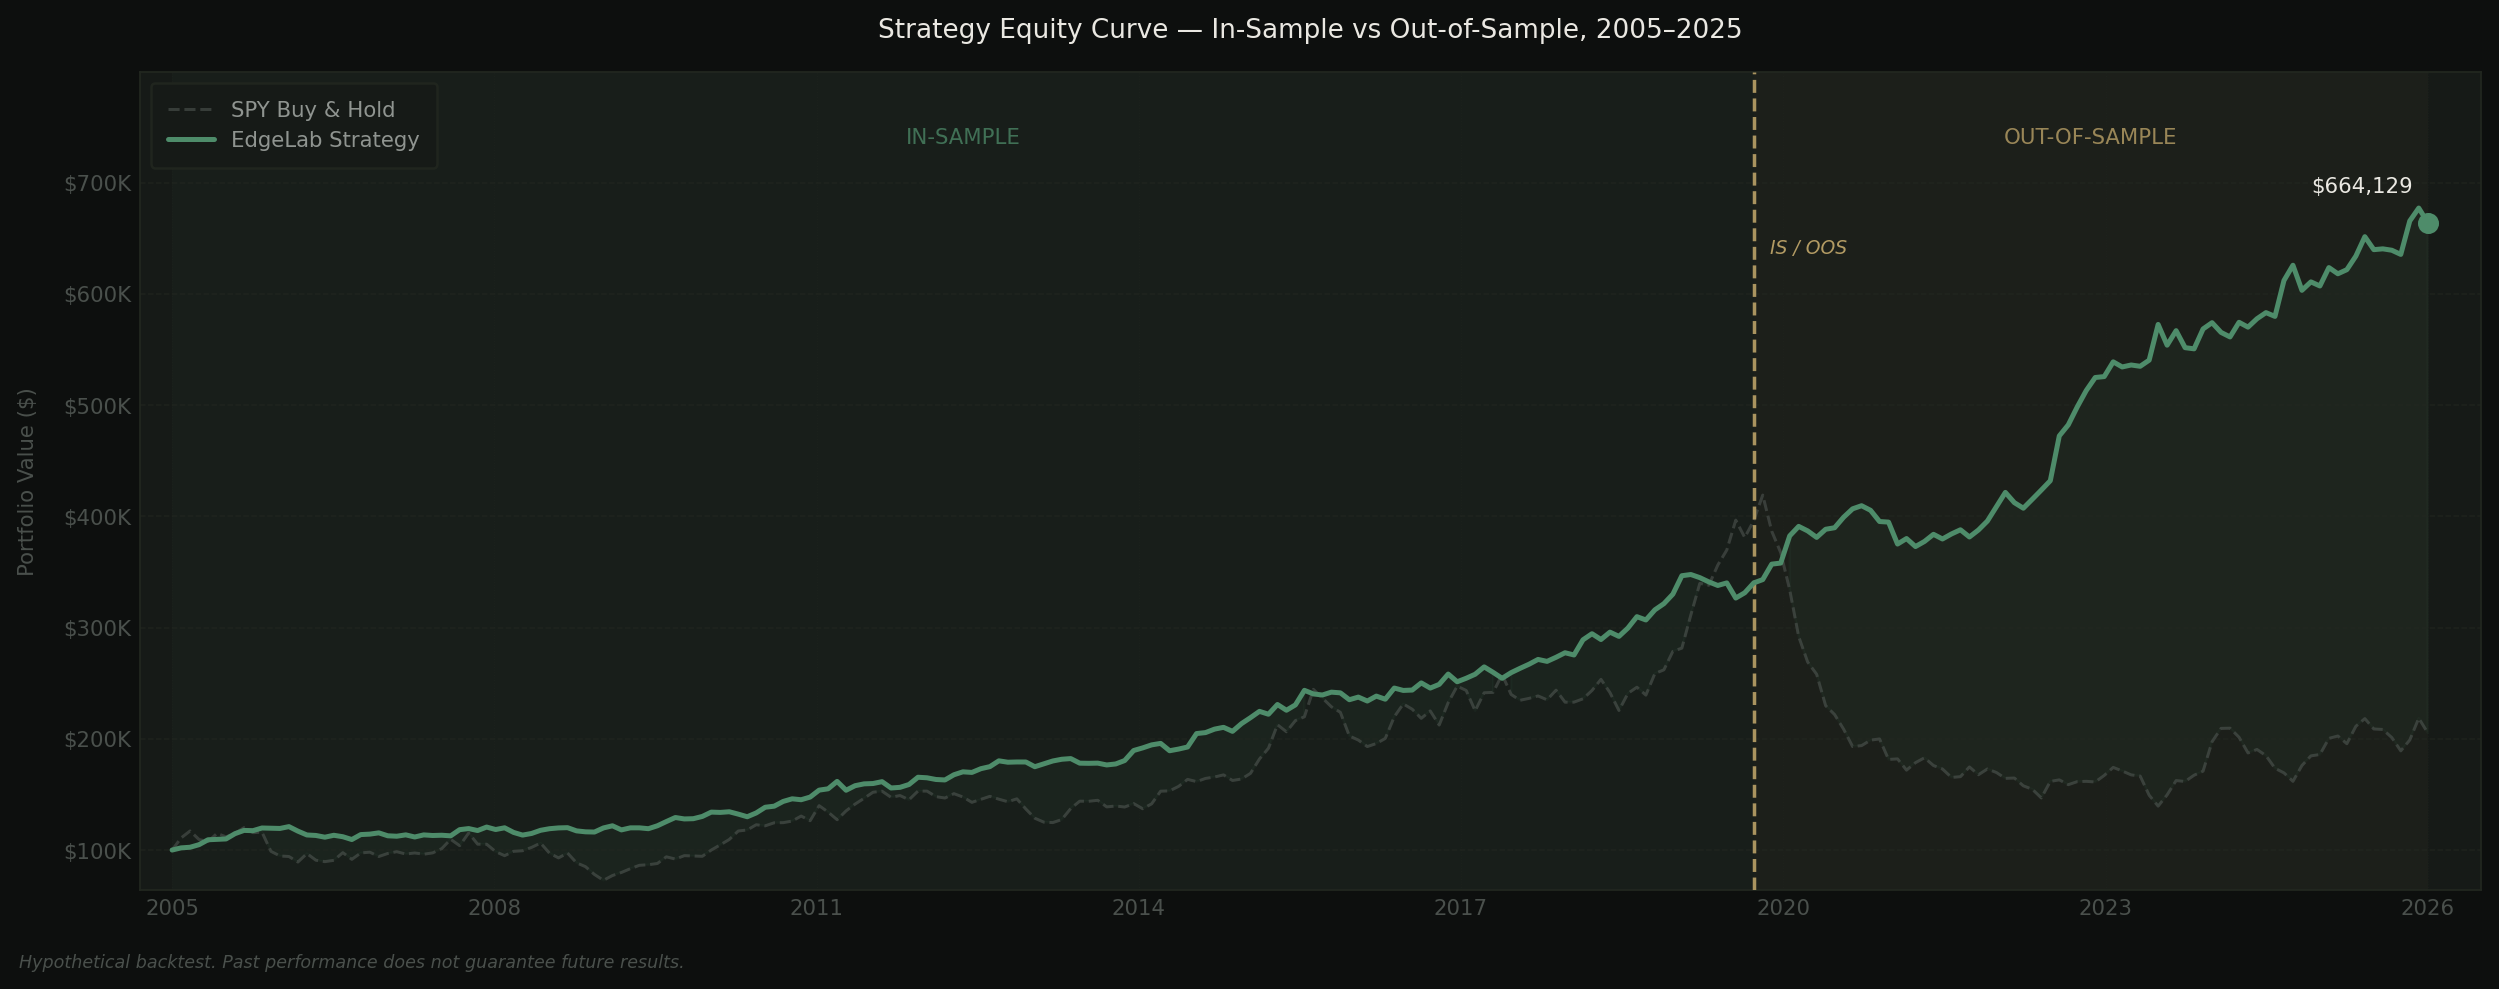
The short version: a backtest only predicts live performance if part of the data was locked away during development and used exactly once. Strategies tuned on all available data describe the past — they don't forecast anything. Below: a real strategy that survived out-of-sample testing, a deliberately overfit one that didn't, and the three filters every EdgeLab strategy must pass.
The backtest trap
Every strategy looks good in backtests. That's not a compliment.
A backtest that uses all available data for both development and evaluation is guaranteed to "work" — you're grading yourself on the same test you studied from. The strategy isn't predicting anything. It's describing what already happened.
The problem isn't the backtest tool. It's the process. Most traders develop a strategy, run it on the full history, adjust parameters until the equity curve looks right, and call it done. What they've built is a model of the past — not of the future.
If every strategy you build passes your process, your process isn't filtering anything.
We built an overfit strategy on purpose
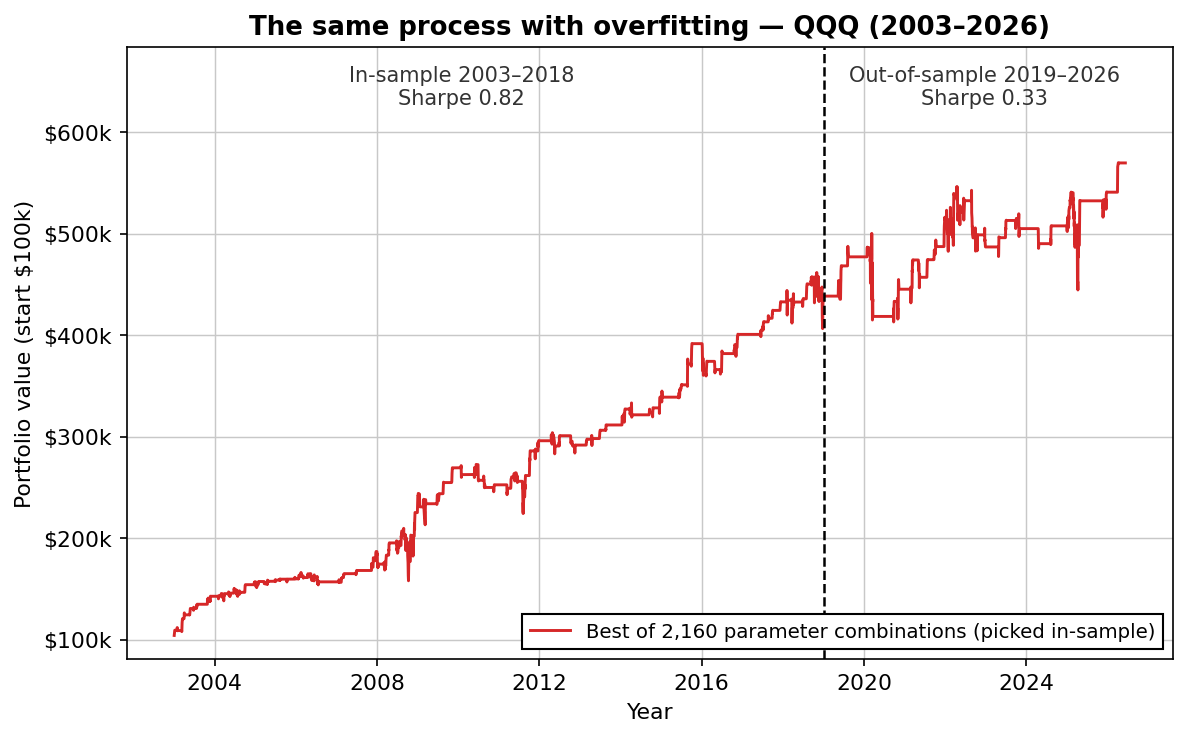
To show what this looks like with real money-shaped numbers, we ran an experiment on QQQ data in June 2026. We took a typical parameter soup — RSI period and threshold, a moving-average filter, a day-of-week condition, holding period, long or short — and brute-forced every combination on the in-sample years 2003–2018. 2,160 backtests, keeping the one with the best Sharpe ratio.
The winner sounded exactly like the rules you see sold online: buy QQQ on Mondays when RSI(3) is below 30 and price is under the 20-day moving average, exit after five days. In-sample it looked great — Sharpe 0.82, steady curve, 13 profitable years out of 16. If we had stopped here, it would have been easy to believe we'd found something.
Then we ran it on 2019–2026, the data it had never seen:
| In-sample (2003–2018) | Out-of-sample (2019–2026) | |
|---|---|---|
| Overfit strategy — CAGR | 9.4% | 3.6% |
| Overfit strategy — Sharpe | 0.82 | 0.33 |
| Survivor (two-rule strategy) — CAGR | 10.1% | 15.6% |
| Survivor (two-rule strategy) — Sharpe | 0.79 | 1.04 |
It wasn't just the single winner. The twenty best in-sample combinations averaged a 0.69 Sharpe during development — and 0.42 on unseen data. Meanwhile the simple two-condition strategy in the chart at the top of this article, built once with no optimization sweep, improved out-of-sample. That asymmetry is the entire argument for what follows.
What out-of-sample testing actually means
Before we start developing any strategy, a portion of the price history gets locked away. No parameters are tuned against it. No entries, exits, or filters are tested on it. That data doesn't exist until development is finished.
Once the strategy is built and validated on the in-sample window, it runs once — exactly once — on the out-of-sample data. Whatever the result is, that's the result. No re-optimization. No "let me just adjust that one parameter." If it fails OOS, the strategy is rejected. That's the whole point.
The OOS window is typically the most recent 20–30% of available history. You want the strategy to have seen less data during development, not more — more data during development just means more opportunity to memorize noise.
Why a high rejection rate is a feature
More than 80% of the strategies we develop get rejected. That number isn't embarrassing — it's the mechanism.
If you're not rejecting most of what you build, you're not testing. You're curating. The goal is to fail strategies quickly, cheaply, and before real money is involved — not to find a way to make every idea look publishable.
The strategies that survive have passed a filter specifically designed to catch overfit curves. The ones that fail are exactly what they look like: backtests that worked on the data they were tuned on, and nothing else.
The three tests every EdgeLab strategy passes
Out-of-sample performance is the first filter — not the only one:
- Sensitivity analysis. Entry and exit parameters are shifted ±20–30% in every direction. If performance collapses when a parameter moves slightly, the edge is fragile. Robust strategies work across a range of settings — not just at the one that looked best.
- Monte Carlo simulation. Trade order is randomized across thousands of scenarios, stress-testing drawdowns the historical sequence happened to avoid. A backtested 6% max drawdown can easily be a 14% drawdown in simulation — better to know before trading it.
- Logic review. Is there a structural reason the edge should exist — weekend sentiment, institutional flows, risk premia? A strategy that passes every quantitative test but has no plausible mechanism doesn't get published either.
If you're building strategies right now
Set aside the most recent 20–30% of your data before you open the backtester. Don't look at it. Don't "just check" it. Develop entirely on the rest, then run one single test on the held-out window when you're done. Whatever comes out is your real result.
If that process kills most of what you build — it's working.
FAQ
What is out-of-sample testing?
Out-of-sample (OOS) testing means locking away a portion of historical data — typically the most recent 20–30% — before developing a strategy, then running the finished strategy on that unseen data exactly once. Because no parameter was tuned on it, the OOS result is the closest a backtest gets to an honest prediction of live performance.
What is overfitting in a trading strategy?
Overfitting is when parameters are tuned until they fit the historical data's random noise rather than a persistent market effect. An overfit strategy shows excellent backtest results and weak live results. In our experiment above, the best of 2,160 optimized combinations earned a 0.82 Sharpe in-sample and 0.33 out-of-sample.
How much data should be held out-of-sample?
A common and defensible split is 70/30: develop on the older 70%, validate once on the most recent 30%. The OOS window must be long enough to contain different market regimes — for daily strategies, several years and at least roughly a hundred trades.
Want strategies that already passed these tests?
Join the list and get two complete strategy reports — out-of-sample validated, sensitivity-tested, Monte Carlo-simulated. Free.
No spam. Unsubscribe anytime.

Robin Eriksson
Founder of EdgeLab. Five years of discretionary losses taught me to test everything — now I publish the strategies that survive. About me →
Related: The Turnaround Tuesday strategy — rules and 23 years of backtest data · Are paid trading strategies worth it? A buyer's checklist · Buying the dip in QQQ: 23 years of evidence
