Simple, systematic trading strategies — tested and shown in full.
EdgeLab publishes rules-based strategies with the exact rules, honest backtests and the code — all shown. Every one is tested on data it has never seen before I publish it, so you can check it yourself before you trade it. Most of what I test fails. What's here didn't.
A few minutes a day
The strategies are in cash most of the time and act on one alert after the close. You check it in a few minutes, not all day.
Rules, not gut feel
Every rule is plain English. You always know why a trade opened and when it closes — no black box, no guessing.
Check it yourself first
Each strategy is tested on data it never saw, with every trade shown and the code included. Verify it, then decide.
Latest research
-
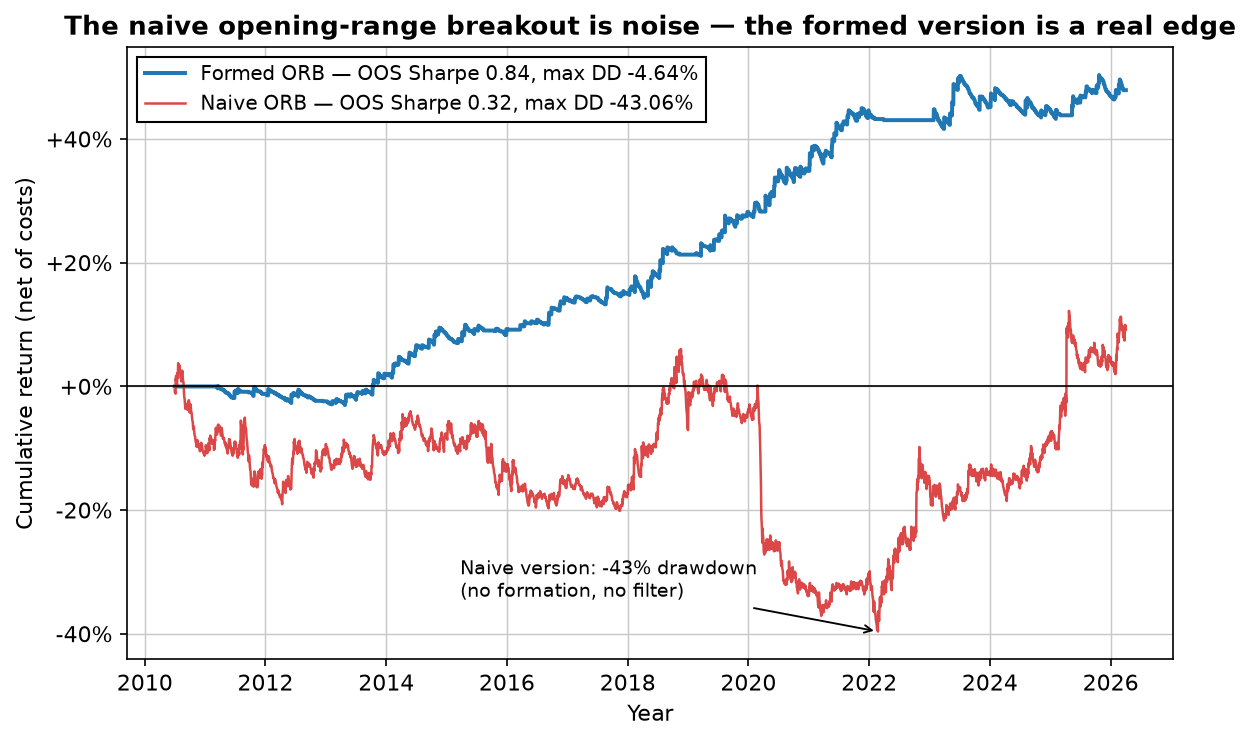
Is the opening range breakout dead? We tested it on the Nasdaq
The internet says the opening range breakout is dead. On 16 years of Nasdaq futures data the naive version is — negative in-sample, a -43% drawdown. But trade the direction of the opening move instead, with a trend filter and a tight stop, and the same idea earns an out-of-sample Sharpe of 0.84 with a -4.6% max drawdown. The one difference that flips it.
-
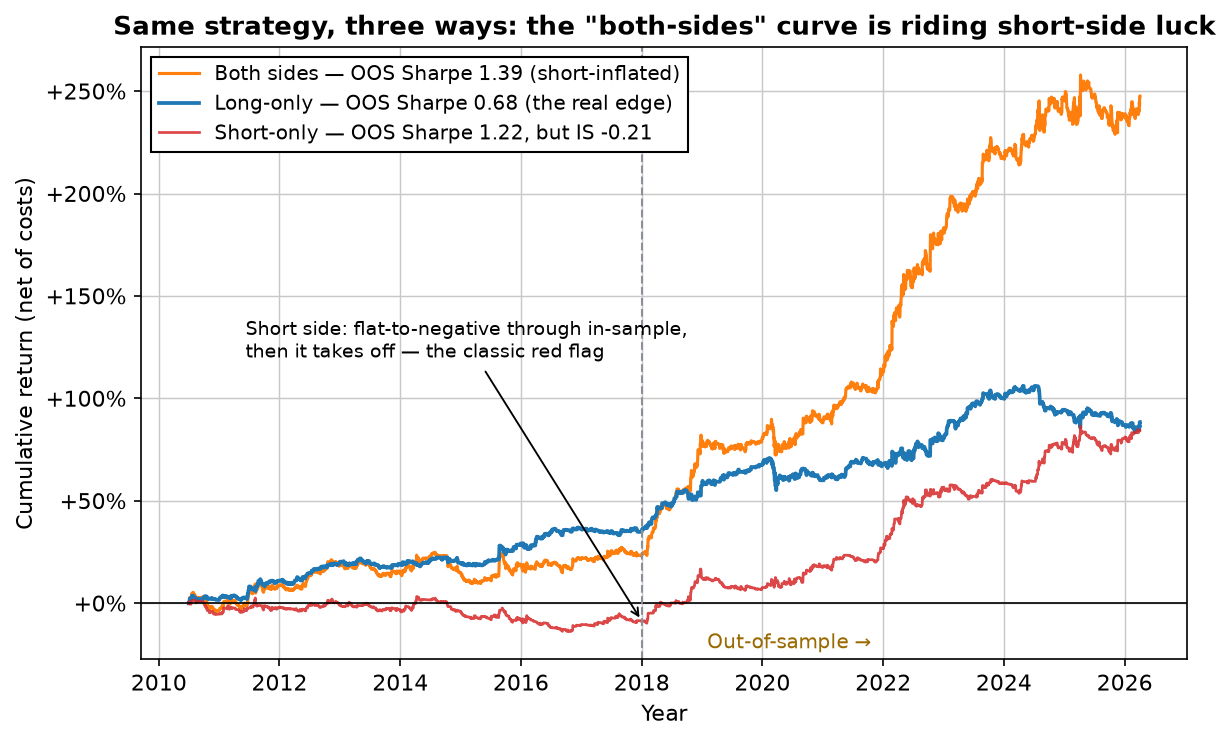
Zarattini's intraday momentum on the Nasdaq: the long side survives, the short side is a mirage
The famous 'Beat the Market' intraday momentum strategy, rebuilt on 16 years of Nasdaq futures and split in two. The long side held up out-of-sample (Sharpe 0.68 business-day, 1.18 per trading day); the short side was negative in-sample and only profitable out-of-sample — regime luck, not an edge. Why the headline 'both-sides' number is a trap.
-
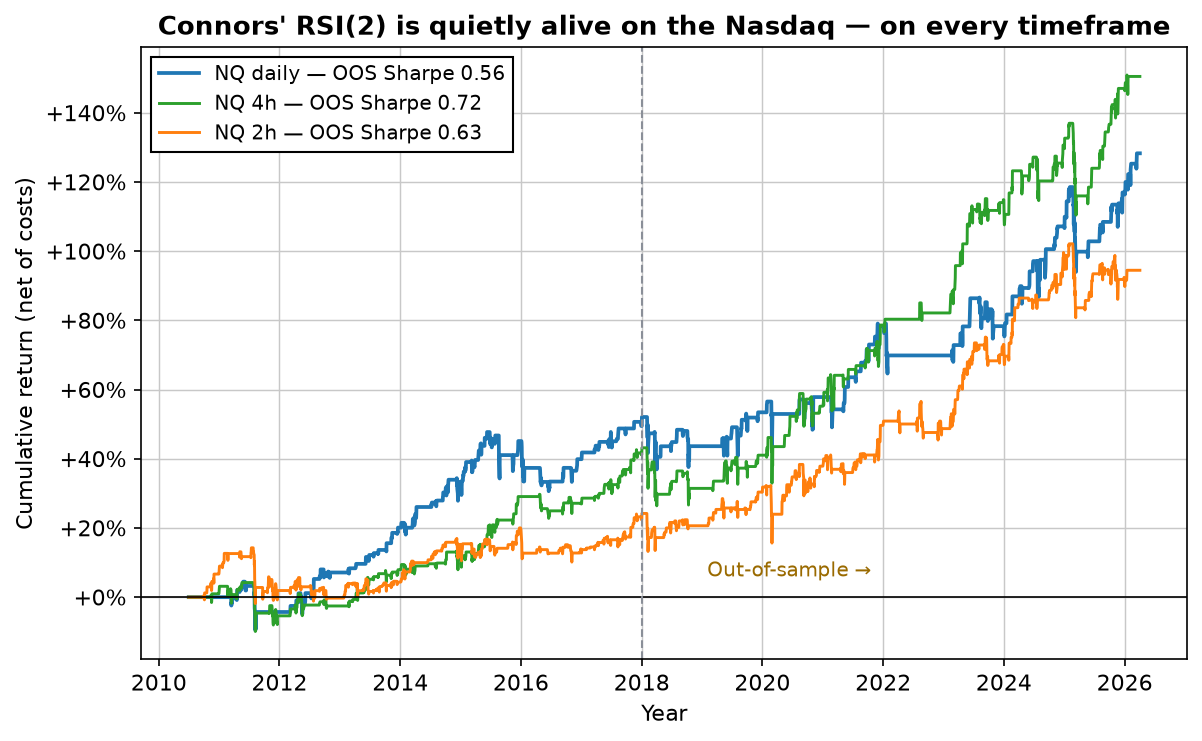
Does Connors' RSI(2) still work? We tested it on the Nasdaq
The internet says Connors' 2-period RSI is dead. On 16 years of Nasdaq futures it's quietly alive across daily, 2h and 4h — out-of-sample Sharpe 0.56 to 0.78, net of costs, even the elaborate TPS scale-in. It didn't die; it got crowded — the difference between a strategy that's broken and one everyone already owns.
-
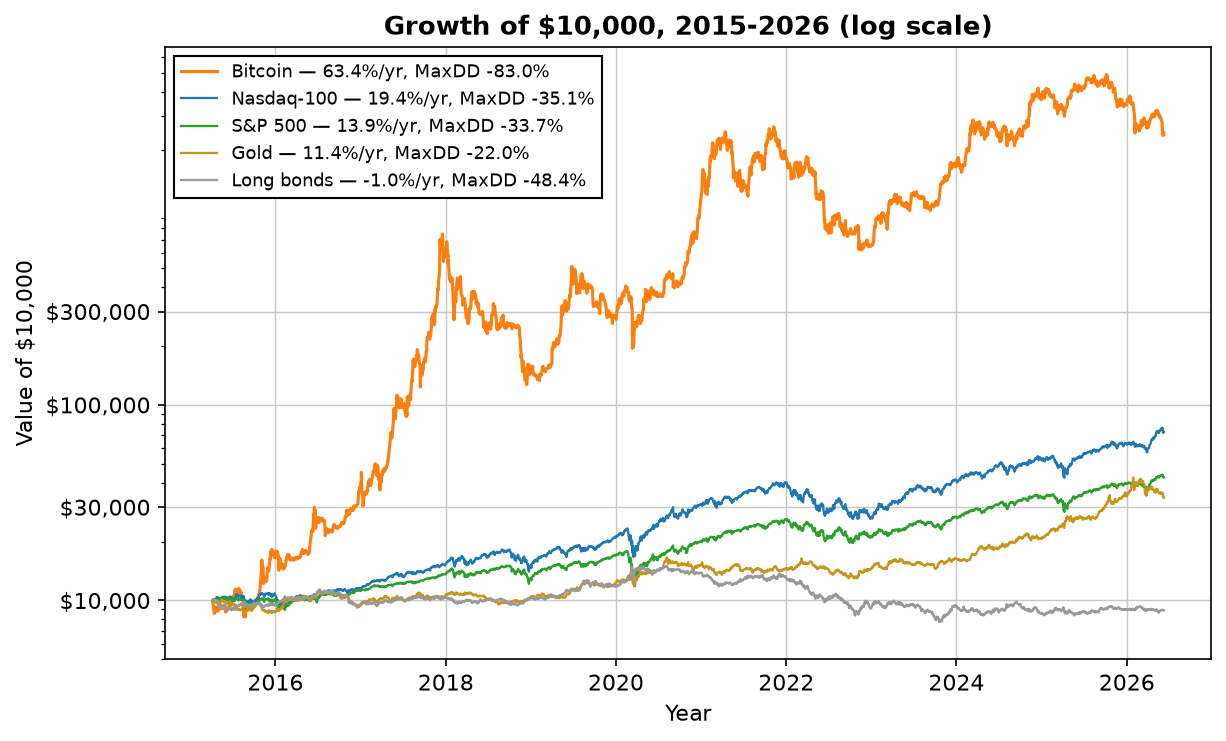
SPY vs QQQ vs gold vs bitcoin: the best asset, risk-adjusted
Stocks, gold, bonds and bitcoin over 11 years, ranked honestly. Bitcoin won on raw return — with an -83% drawdown and a -74% year. But an equal-weight mix of all five beat every single one on risk-adjusted return. Why chasing the winner is the wrong lesson.
Download the free strategy
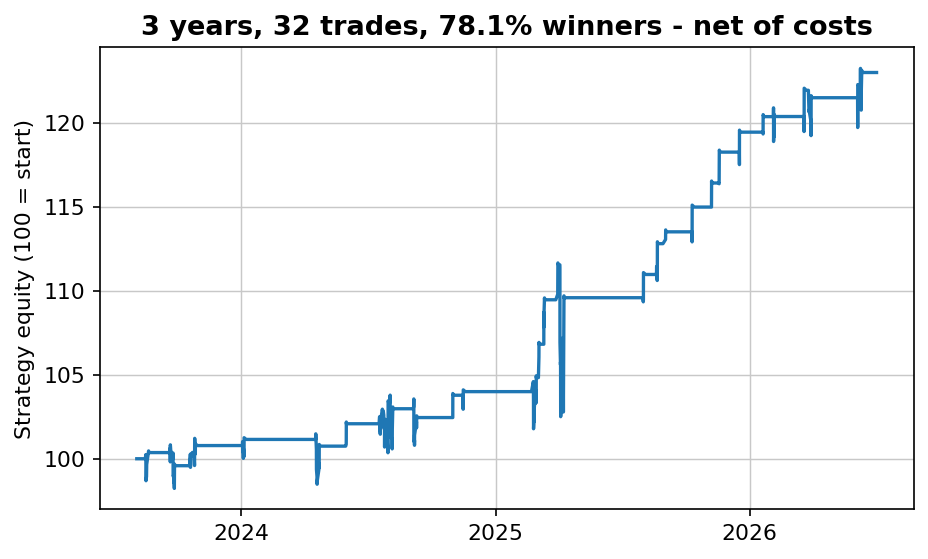
A simple RSI-based strategy with a handful of clear rules. Over 15.8 years it has taken 155 trades — 109 winners (70%) — with a worst drawdown of -11.5%, net of costs, and it earned more in the second half of that record than the first. It's in the market about 8% of the time: one alert does the watching, your capital sits safe between signals, and the markets get minutes of your day instead of owning it.
The free report gives you the market, the timeframe and the exact rules — in plain English, they fit on a sticky note — plus every single trade with timestamps, 23 years of long-run evidence for the idea, and the honest caveats. Nothing held back, nothing to buy first.
Download the free strategy
One PDF: the market, the timeframe, the exact rules — plus all 155 trades and what it honestly earns.
Instant delivery. One PDF, no spam. Unsubscribe anytime.
How we test
Every strategy published on EdgeLab has passed the same three filters:
- Out-of-sample validation. The most recent 20–30% of price history is locked away during development and used exactly once. If the strategy fails there, it's rejected.
- Sensitivity analysis. Every parameter is shifted ±20–30%. If the edge only exists at one magic setting, it's curve fitting — rejected.
- Monte Carlo simulation. Trade order is randomized across thousands of runs to stress-test drawdowns beyond what the historical sequence happened to produce.
And every backtest pays its way: we charge 0.05% per side in commission and slippage — roughly two to three times what a liquid ETF actually costs to trade at a decent broker. If an edge can't survive costs it will never pay in real life, so we'd rather understate every number on this site than flatter one.
More than 80% of the strategies we develop are rejected. Here's why that rejection rate is the whole point →
Who's behind this
I'm Robin Eriksson. I spent my first five years in the markets losing money on gut feel and chart patterns — steadily, a good month then two bad ones — before systematic trading turned it around. The real change wasn't a better indicator; it was that the markets stopped owning my evenings, and drawdowns became something I'd already met in testing instead of a reason to lie awake. Trading was supposed to buy freedom. Systematic is the version that actually did. EdgeLab is where I publish the research — and I trade these strategies with my own money. More about me and the methodology →
