I'm Robin Eriksson, and EdgeLab is where I publish systematic trading research: strategies with exact rules, honest backtests, and the code to reproduce them.
Five years of losing first
I traded on discretion for my first five years — chart patterns, conviction, gut feel. I lost money for most of them. Not dramatically, just steadily: a good month, two bad ones, repeat. What finally changed things wasn't a better indicator. It was admitting that I couldn't tell whether anything I did actually worked, because I had never tested any of it.
So I started testing. First in TradingView and Pine Script, where I built and broke hundreds of strategy ideas. Later in Python, where the real lesson arrived: most strategies that look profitable in a backtest fall apart on data they haven't seen. The few that survive honest testing tend to be simple, a little boring, and built on effects that have existed for decades.
That lesson — and the testing process that came out of it — is what EdgeLab is built on.
The practical difference matters more to me than any single number: rules mean the markets get minutes of my day instead of owning my evenings, and drawdowns are something I've already met in testing rather than a reason to lie awake. Trading was supposed to buy freedom. Systematic is the version of it that actually did.
What gets published here
Every strategy on this site has been through the same three filters before you see it:
- Out-of-sample validation. The most recent 20–30% of price history is locked away during development and used exactly once. Fail there, and the strategy is rejected.
- Sensitivity analysis. Each parameter is shifted ±20–30%. If returns collapse when a setting moves slightly, the "edge" was curve fitting.
- Monte Carlo simulation. Trade order is randomized across thousands of runs to find drawdowns the historical sequence got lucky enough to avoid.
More than 80% of what I build gets rejected by this process — 150+ strategies tested, and the survivors fit in one short list. That's not a bug; it's the entire point. If everything you test passes, your tests aren't filtering anything.
I trade this myself
I'm not a fund, and this isn't theory. I run strategies from this library with my own money through Interactive Brokers and Darwinex Zero. When a strategy I've published behaves differently live than it did in testing, you'll read about that too — the failures are at least as instructive as the wins.
I also walk through strategies on video — start with the RSI 30/40 strategy on YouTube, then read the full backtest behind it.
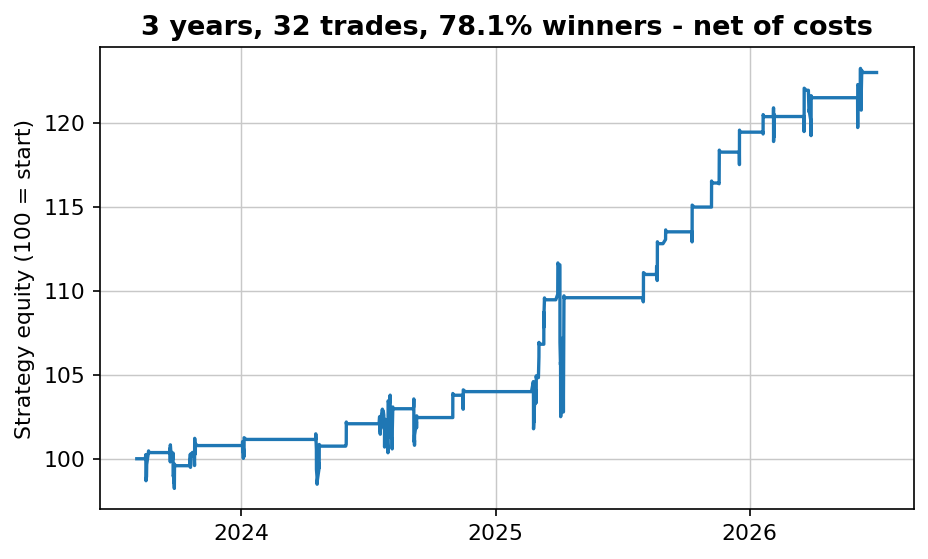
Why the charts look the way they do
Every chart on this site is generated in Python — matplotlib, white background, no decoration — straight from the backtest that produced the numbers. If a chart is in an article, the data behind it is real, and in most cases you can download the script and reproduce it yourself.
Get in touch
The easiest way to reach me is to join the email list and reply to any email. It's me reading — not a support inbox.
Download the free strategy
Join the list and get the complete strategy report — the market, the timeframe and the exact rules in plain English, every trade it has taken, honest caveats — plus new research as it's published.
No spam. Unsubscribe anytime.