The whole strategy
- Buy QQQ (or the Nasdaq-100) at the close when the 14-day RSI is at or below 30.
- Sell at the close when RSI(14) is back at or above 40.
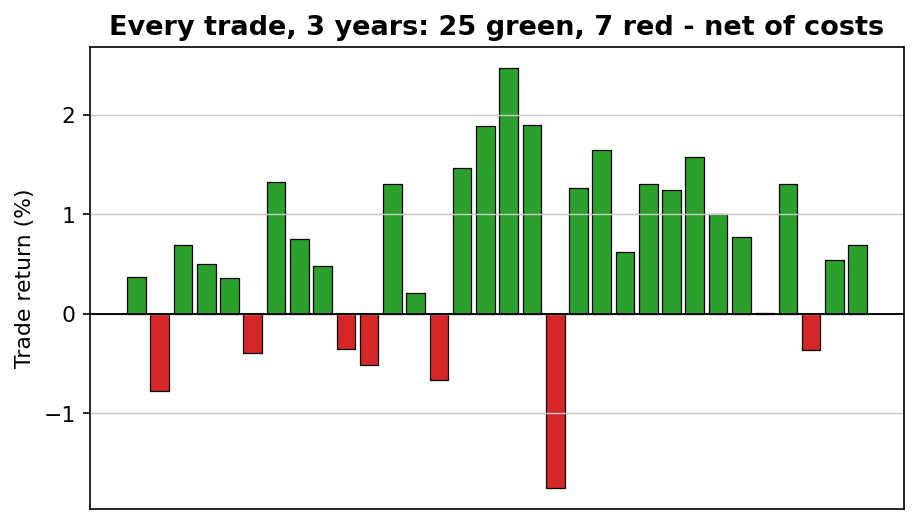
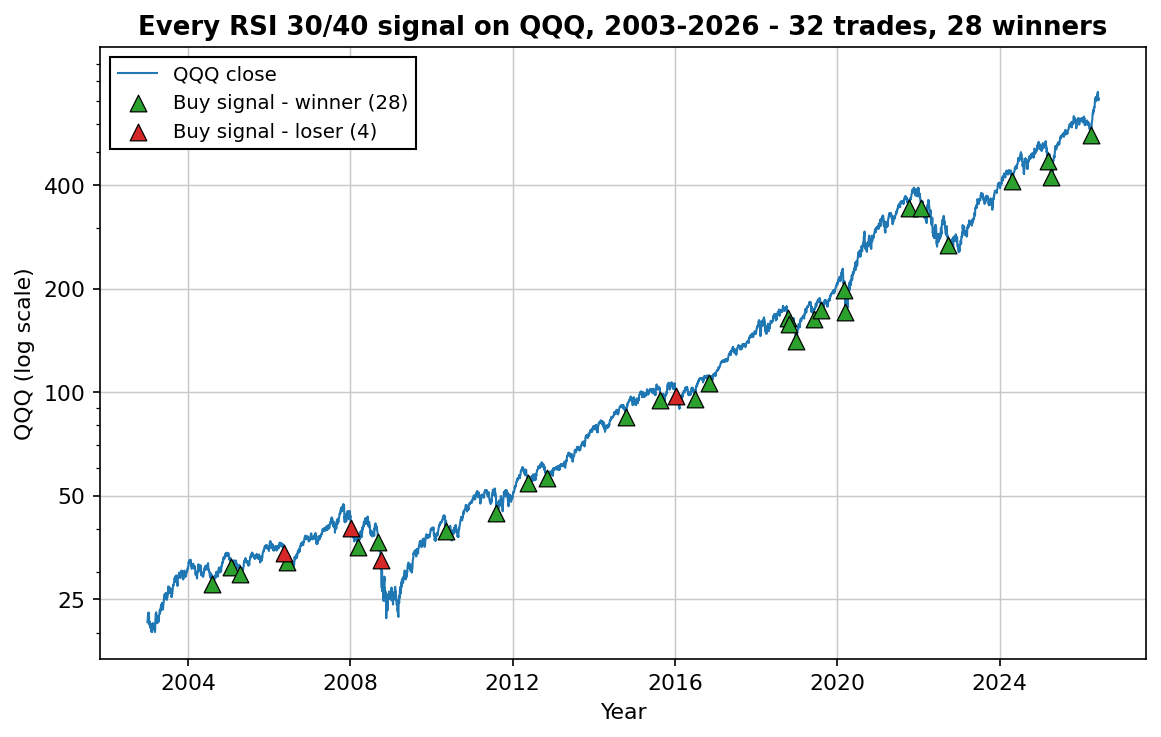
Long only, no leverage, no stop, nothing else. On the 2-hour chart — the timeframe in the video — it signals about 11 times a year: 32 trades over the past three years, 25 winners (78%), worst drawdown -8.2%, net of costs. On the daily chart it's rarer and even sharper: 28 of 32 winners since 2003. Either way, one alert does the watching — you get on with your life until it fires.
Get the free report
One PDF: the rules, every 2-hour trade from the past three years with timestamps, 23 years of daily evidence, a faster RSI(2) variant — and what they honestly earn after costs.
One PDF, no spam. Unsubscribe anytime. A second, uncorrelated strategy follows by email a few days later.
Want the full backtest first — every number, the worst trade, the fast variant and how it fits into a portfolio? Read the complete analysis →