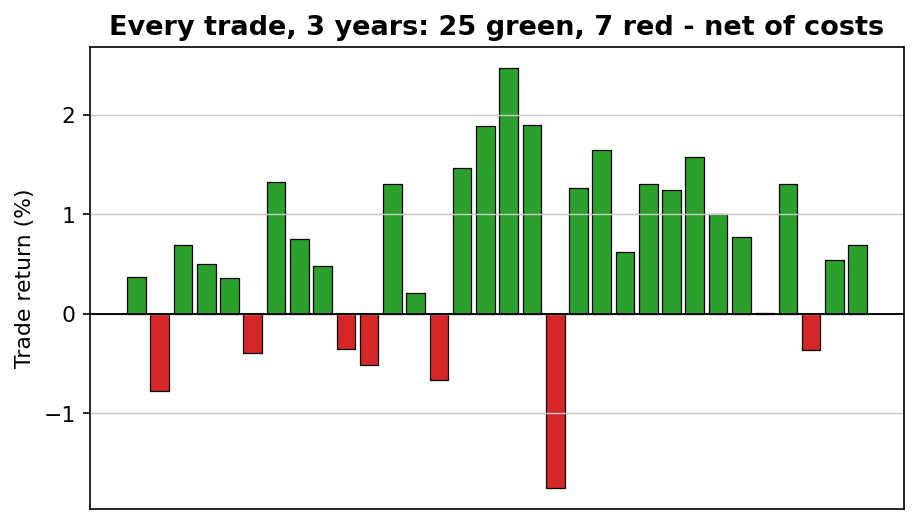
The short version: buy QQQ when RSI(14) hits 30, sell at 40. On the 2-hour chart — the video's timeframe — that produced 32 trades in the past three years: 25 winners (78.1%) with a -8.2% worst drawdown, net of costs. On the daily chart the same rules fired 32 times in 23 years and won 28 (since 2014: 18 of 19). The catch on both: time in market is tiny, so raw compounding is modest — this is a precision tool, not a complete system. The faster RSI(2) daily variant compounded 9.7% a year with a third of buy-and-hold's drawdown. All the data below.
The rules — all of them
- Buy QQQ at the close when the 14-day RSI is at or below 30.
- Sell at the close when RSI(14) is back at or above 40.
Long only, no leverage, no stop-loss, no filters. That's genuinely the whole thing. RSI(14) below 30 is rare on a diversified index — it takes a real panic — which is exactly why the signal is worth waiting for. In practice you set one alert and get on with your life; the market will tell you when it's time, roughly once or twice a year.
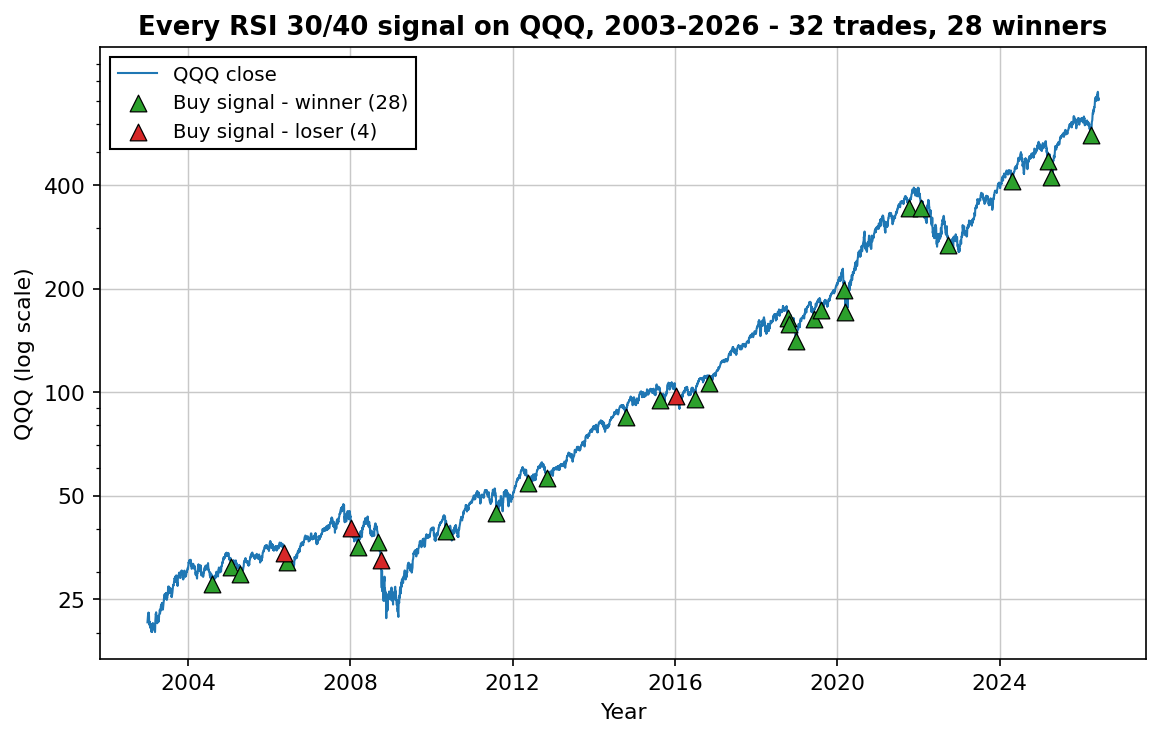
Every signal since 2003
Here is every entry the strategy has ever generated on daily QQQ data, net of 0.05% commission per side. Not a sample — all of them:
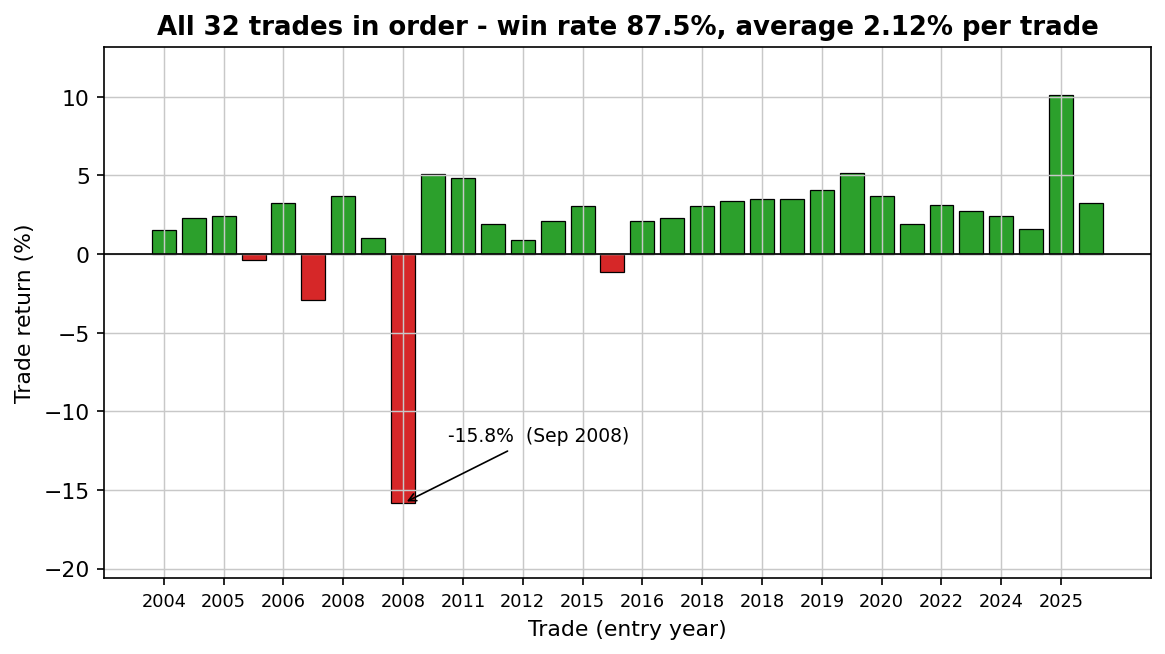
And because an equity curve can hide a lot, here is the full trade log. Most strategy sellers won't show you this; we think it's the only honest way to present a rare-signal system:
| # | Entry | Exit | Days held | Return |
|---|---|---|---|---|
| 1 | 2004-08-06 | 2004-08-17 | 7 | +1.55% |
| 2 | 2005-01-24 | 2005-01-31 | 5 | +2.28% |
| 3 | 2005-04-15 | 2005-04-21 | 4 | +2.43% |
| 4 | 2006-05-16 | 2006-06-01 | 11 | -0.40% |
| 5 | 2006-06-12 | 2006-06-15 | 3 | +3.24% |
| 6 | 2008-01-08 | 2008-02-01 | 17 | -2.93% |
| 7 | 2008-03-10 | 2008-03-11 | 1 | +3.70% |
| 8 | 2008-09-09 | 2008-09-19 | 8 | +1.03% |
| 9 | 2008-09-29 | 2008-10-28 | 21 | -15.84% |
| 10 | 2010-05-07 | 2010-05-10 | 1 | +5.09% |
| 11 | 2011-08-08 | 2011-08-11 | 3 | +4.86% |
| 12 | 2012-05-17 | 2012-05-29 | 7 | +1.93% |
| 13 | 2012-11-08 | 2012-11-19 | 7 | +0.88% |
| 14 | 2014-10-15 | 2014-10-20 | 3 | +2.08% |
| 15 | 2015-08-21 | 2015-08-27 | 4 | +3.06% |
| 16 | 2016-01-07 | 2016-01-22 | 10 | -1.15% |
| 17 | 2016-06-27 | 2016-06-28 | 1 | +2.09% |
| 18 | 2016-11-04 | 2016-11-07 | 1 | +2.27% |
| 19 | 2018-10-10 | 2018-10-16 | 4 | +3.09% |
| 20 | 2018-10-24 | 2018-10-25 | 1 | +3.36% |
| 21 | 2018-12-21 | 2018-12-26 | 2 | +3.51% |
| 22 | 2019-06-03 | 2019-06-05 | 2 | +3.48% |
| 23 | 2019-08-05 | 2019-08-08 | 3 | +4.06% |
| 24 | 2020-02-27 | 2020-03-02 | 2 | +5.14% |
| 25 | 2020-03-12 | 2020-03-24 | 8 | +3.69% |
| 26 | 2021-10-04 | 2021-10-06 | 2 | +1.90% |
| 27 | 2022-01-21 | 2022-01-31 | 6 | +3.13% |
| 28 | 2022-09-26 | 2022-10-04 | 6 | +2.73% |
| 29 | 2024-04-19 | 2024-04-23 | 2 | +2.41% |
| 30 | 2025-03-10 | 2025-03-19 | 7 | +1.62% |
| 31 | 2025-04-04 | 2025-04-09 | 3 | +10.14% |
| 32 | 2026-03-30 | 2026-03-31 | 1 | +3.28% |
Study row 9 before anything else. That's the September 2008 entry: RSI said "panic, buy" — and the panic kept going for 21 trading days and -15.8%. No stop-loss means when the exception comes, you ride all of it. That trade is the strategy's honest price tag, and something like it will happen again. (Row 31 is the other side of the same coin: the April 2025 tariff crash, +10.1% in three days.)
The honest part: what it earns on its own
An 87.5% win rate sounds like a money machine, so let's do the arithmetic the sales pages skip. The strategy is in the market 2.8% of the time. Thirty-two trades averaging +2.12% over 23 years compounds to roughly 2.8% a year — far less than buy-and-hold's 16.1%. That's not a flaw in the test; it's what "rare and precise" means. You're being paid a remarkably high rate per day of risk taken, but there aren't many of those days.
So judge it as what it is: a tactical component. It waits for the handful of days each year when the Nasdaq is genuinely washed out, takes the bounce, and hands your capital back. The other 97% of the time that capital is free — free to sit safe, or free to run other strategies that make money in different ways. That framing matters more than any single number in this article, and it's where the portfolio math takes over.
The 2-hour timeframe: the video's version, verified
Reliable intraday history reaches back about three years, and over that window the 2-hour version took 32 trades — 25 winners (78.1%), average +0.65% per trade, worst single trade -1.75% (the April 2025 crash), max drawdown -8.2%, in the market 7.6% of the time. Net of 0.05% per side. About 11 signals a year instead of one or two: the same edge, ten times the opportunities.
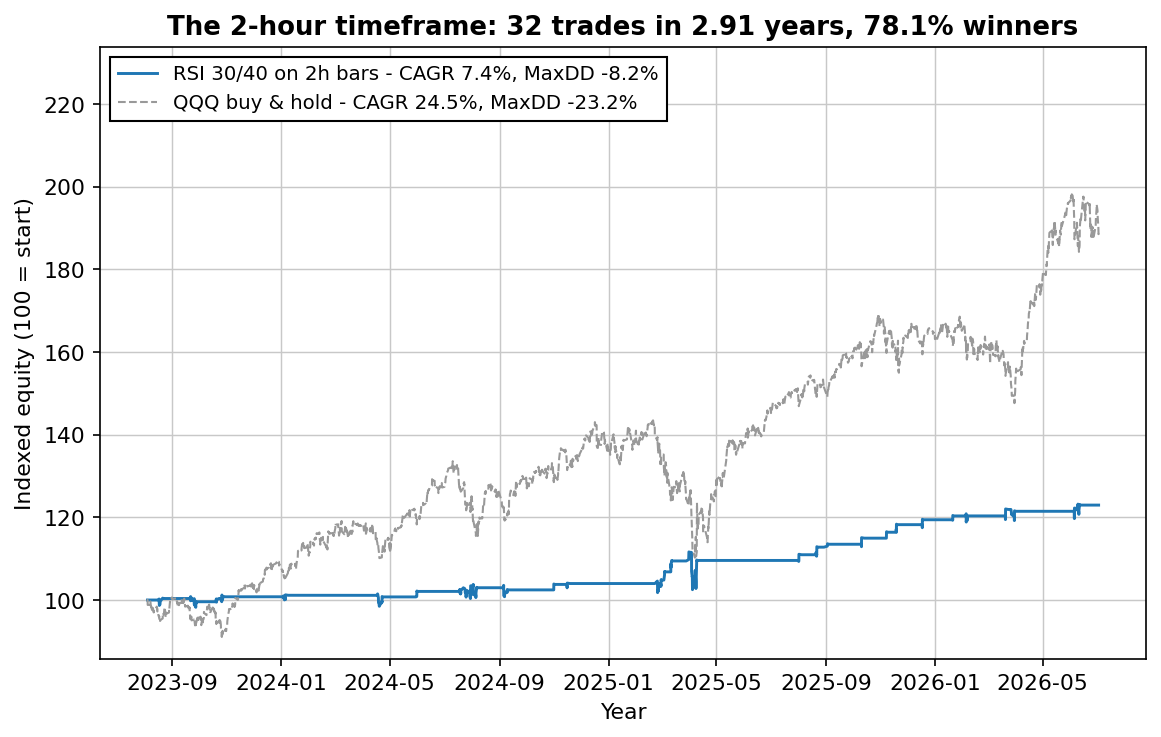
Two honest notes. Three years is a real sample, not proof — the 23-year daily record above is why we trust the idea. And we ran the identical rules on 1-hour bars too: 46 trades, 65% winners, 3.1% a year — clearly worse. Faster is not better; 2-hour bars filter the noise that 1-hour bars trade. On weekly bars the signal fires a handful of times per decade — skip it.
Want more signals? The fast variant: RSI(2)
Keep the thresholds, swap the lookback: a 2-day RSI instead of 14. Same logic — buy short-term panic, sell the recovery — but the 2-day RSI dips to 30 roughly once a week instead of once a year. That turns a rare tactical signal into something that can actually carry an account:
| Metric | In-sample 2003–2013 | Out-of-sample 2014–2026 | QQQ buy & hold (full) |
|---|---|---|---|
| CAGR | 6.6% | 12.6% | 16.1% |
| Sharpe ratio | 0.52 | 0.92 | 0.80 |
| Max drawdown | -18.0% | -16.5% | -53.4% |
| Trades | 346 | 383 | — |
| Win rate | 69.1% | 71.5% | — |
| Time in market | 30.7% | 27.2% | 100% |
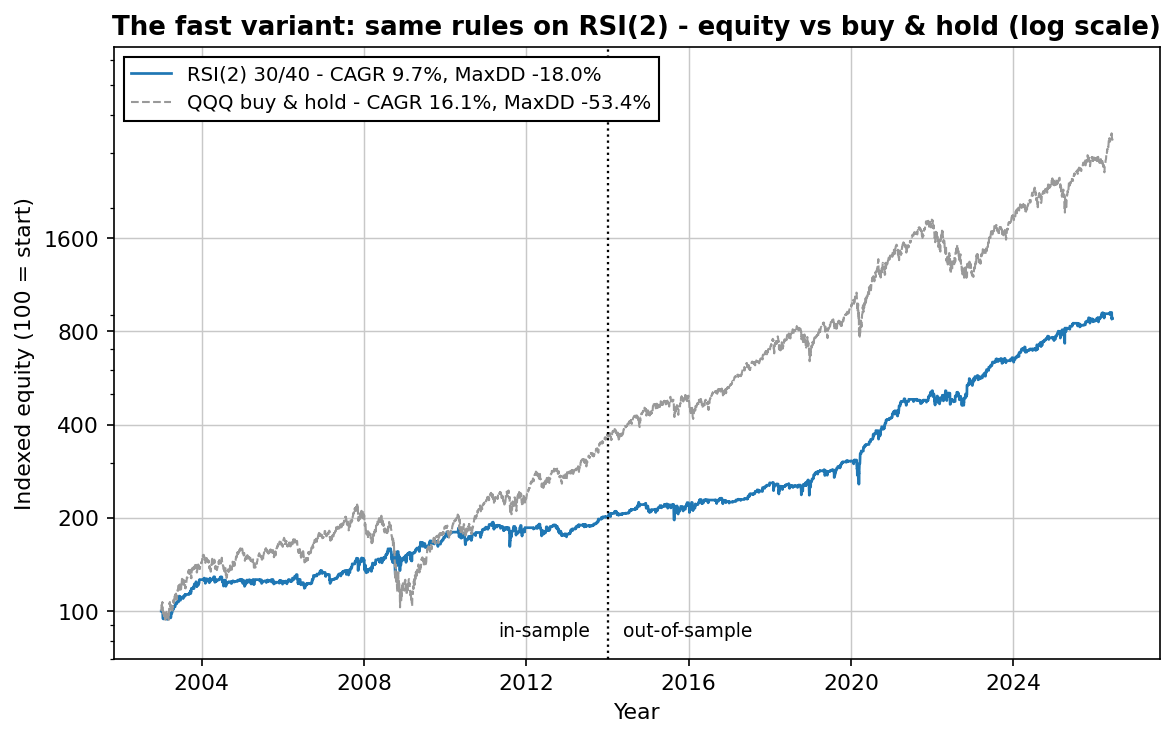
Read the table like a skeptic, the way we read every backtest: the out-of-sample decade was better than the in-sample one (0.92 vs 0.52 Sharpe) — the opposite of what curve fitting looks like. The honest cost: ~2-day holds mean commissions and slippage matter, and the numbers above already charge 0.05% per side. If your execution is materially worse than that, your results will be too. This is the same strategy family as our full dip-buying grid test, where the edge held across every neighboring parameter — a plateau, not a lucky number.
Where it fits: one strategy is a tactic, not a system
Both versions of this strategy do exactly one thing: buy stock-index panic. In a year when stocks bleed slowly without panicking — or panic and keep falling — they will have a bad year, no matter how good the entry rule is. The way simple strategies become an account is not adding rules; it's combining a few that make money in different ways, so that when one bleeds, another is working. The portfolio math is here — one formula, and correlation is the whole game.
Download the free strategy report
Everything in this article as one PDF — the rules, all 32 trades, the fast variant, the honest numbers — plus a second, uncorrelated strategy by email a few days later, and the math for combining them.
One PDF, no spam. Unsubscribe anytime.
FAQ
What is the RSI 30/40 strategy?
Buy QQQ at the close when the 14-day RSI is at or below 30; sell at the close when it's back at or above 40. Long only, no leverage, no other rules. 32 signals in 23 years, 28 winners, ~5 trading days per trade.
Does the RSI strategy work on the Nasdaq?
As a tactical dip signal, measurably yes: 28 of 32 historical signals profitable net of costs, 18 of the last 19. But it's in the market only 2.8% of the time, so standalone it compounds at ~2.8% a year — a high-quality component, not a complete system.
Should I use RSI(2) or RSI(14)?
Same idea, different speeds. RSI(14): once or twice a year, 87.5% win rate. RSI(2): roughly weekly, 9.7% CAGR over the full sample (12.6% out-of-sample) with a -18% max drawdown versus -53% for buy-and-hold. Pick by the job you need done.
Does it work on 2-hour charts?
Yes — verified: on 2-hour QQQ bars over the past three years it took 32 trades with 25 winners (78.1%), a -8.2% max drawdown and about 11 signals a year, net of costs. The identical rules on 1-hour bars were clearly worse (65% winners, 3.1% a year) — 2-hour bars appear to be the sweet spot.

Robin Eriksson
Founder of EdgeLab. Five years of discretionary losses taught me to test everything — now I publish the strategies that survive. About me →
Related: Buying the dip in QQQ: 23 years of evidence, net of costs · The Turnaround Tuesday strategy — rules and 23 years of backtest data · How many trading strategies do you need? The portfolio math