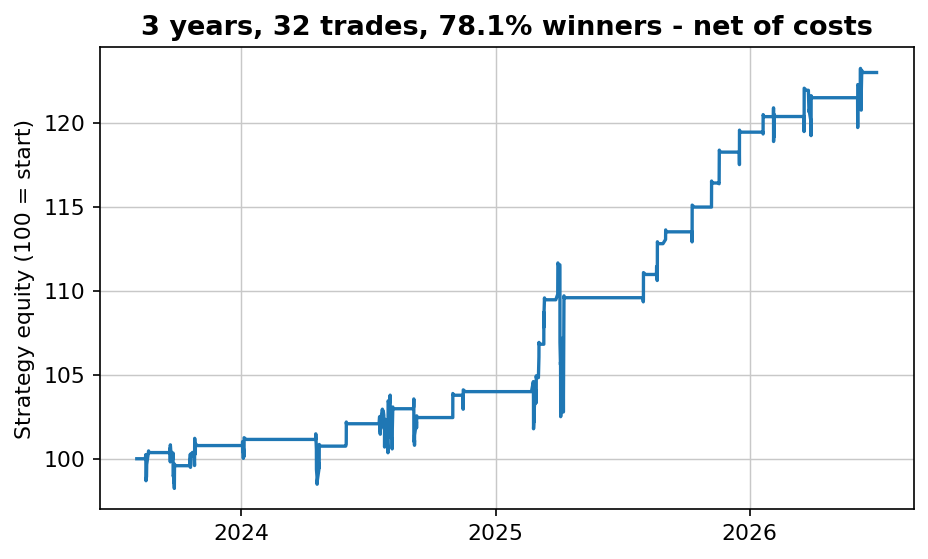
The short version: of 150+ strategies put through an identical pre-registered bar, most didn't clear it — but "didn't clear the bar" means three very different things, and only one of them is dead. Some genuinely collapsed on unseen data (a famous RSI scale-in variant went from 0.96 in-sample to 0.006 out-of-sample). Many were real, profitable edges we simply already owned — the bar rejects anything too correlated with what we run. And some work standalone but need more scale than a retail account reaches. The distinction matters because our whole approach isn't finding perfect strategies — it's stacking many OK, uncorrelated ones. On that view the bar is a correlation filter more than a quality filter, and the real survivors share one trait: they're structural flows, not chart patterns. Below: which is which, honestly.
The bar every strategy had to clear
None of this means anything unless the test is identical and decided before the results come in. Ours is, and it is deliberately strict — it's the bar we use before adding a strategy to real money:
- In-sample Sharpe > 0.3 and out-of-sample Sharpe > 0.5, standalone
- Weekly correlation below 0.3 against everything already in the book
- Measurable portfolio uplift (> 0.05 OOS Sharpe at normal weight)
- A parameter plateau — neighboring settings must work too, or it's curve fitting
- Walk-forward: mean Sharpe > 0.3 across folds, fewer than half negative
- Bootstrap: at least 70% probability the uplift is real, not luck
In-sample window 2010–2018, out-of-sample 2019–2026, volatility-targeted, tier-based real transaction costs. Identical for a 1995 book pattern and for our own best idea. And note criteria 2 and 3: a genuinely profitable strategy fails this bar if it's too correlated with something we already run, or adds no fresh return once it's in the mix. So "failed the bar" splits three ways — truly dead (collapsed out-of-sample), already owned (real edge, but we hold that exposure already), and needs scale (works, but not at a size a retail account reaches). Only the first is a corpse. Here's what the bar did to the famous names, sorted honestly.
Truly dead: the ones that collapsed on unseen data
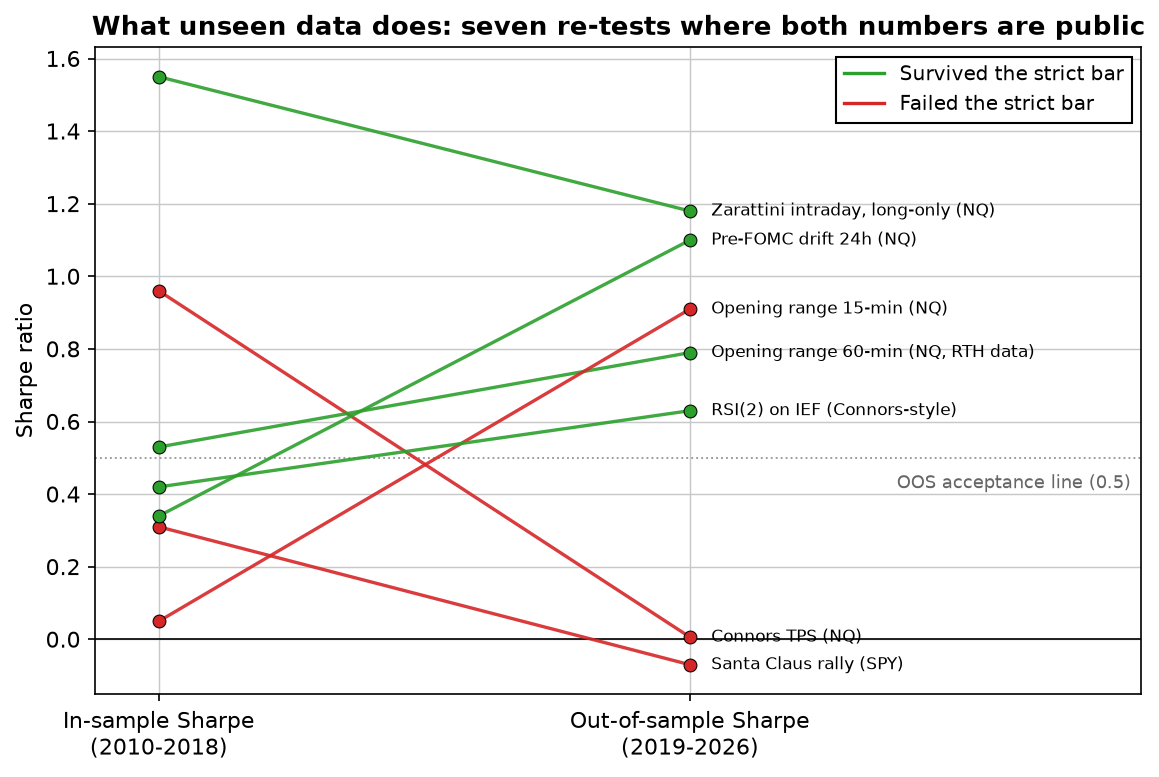
Exhibit A: Connors TPS on the Nasdaq. This is a specific scale-in variant — not plain RSI(2) dip-buying, which is very much alive (more on that below). TPS was the strongest raw performer of its whole batch: Sharpe 0.96, eight positive years out of eight. Out-of-sample: 0.006. Not negative — just nothing. A decade of beautiful backtest compressed into a coin flip the moment the data was unseen. This is why we never publish an in-sample number without its OOS twin.
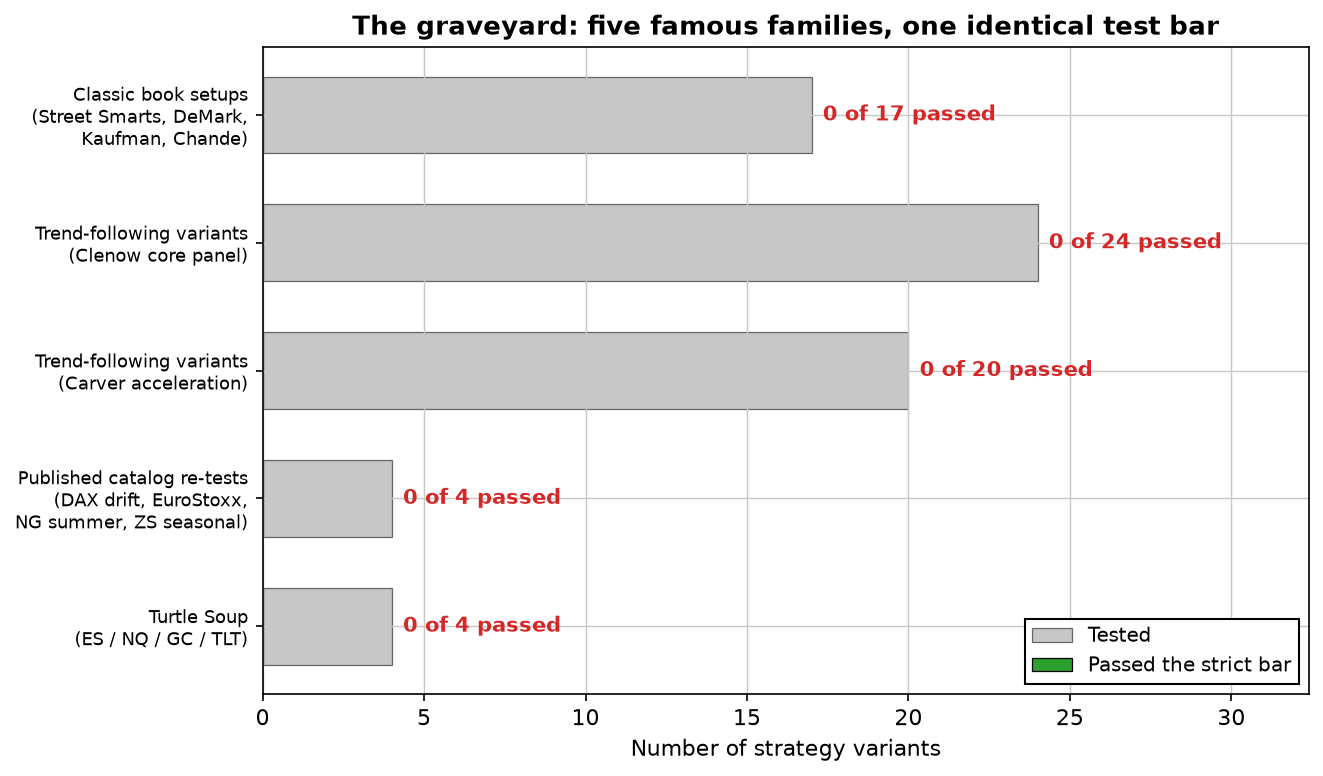
Turtle Soup — the famous failed-breakout fade from Street Smarts (1995) — failed on every market we tried (ES, NQ, GC, TLT), walk-forward means between −0.04 and −0.40. The Santa Claus rally on SPY: +0.31 in-sample, −0.07 out-of-sample, arbitraged after 2018 by everyone reading the same December articles. And four popular published catalog setups — DAX overnight drift, EuroStoxx loss-reversal, natural-gas short-summer, soybean seasonals — all published with pre-2019 backtests, all negative out-of-sample. That's the real graveyard, and it's genuinely dead. It's also smaller than the raw "0 passed" bars suggest — because most of what failed didn't die, it did one of the next two things.
Not dead: already owned, or needs scale
Classic book patterns — 17 tested, 0 cleared the bar. Setups from Raschke & Connors, DeMark, Kaufman and Chande. But our own log is explicit about why they failed, and it's a mix: some are arbitraged after 30 years — and many failed because our live book already derives from the same sources (its building blocks are book-relatives), so the "new" strategy just re-buys an edge we already hold. That's not a dead strategy. It's a duplicate. On a blank account, several of these would be perfectly reasonable first sleeves.
Trend following — 44 variants, 0 cleared the bar. Clenow-style core trend across an 8-instrument panel: 0 of 24. Carver-style acceleration: 0 of 20. But the honest finding isn't "trend is dead" — it's that single-instrument trend runs a Sharpe of 0.2–0.5 and needs 30–100 markets to become an account. Retail-scale panels can't get there, so it fails our bar. Run it at institutional breadth and it's a real strategy — just not one you or I can build alone.
That distinction is the whole point, so watch what unseen data actually does — genuine collapse looks nothing like "already owned":
The survivors share one trait
Here's the full list of families that cleared the bar, with their out-of-sample Sharpes: Turnaround Tuesday (1.30) · RSI(2) mean reversion on liquid equity indices (1.20 — the daily QQQ/SPY dip-buyer, and yes, the same one we run the health-check tripwires on) · IBS mean reversion (1.04) · Zarattini intraday momentum, long-only (1.18) · Friday gold close (1.69 net of costs) · a seasonal sleeve of gold-January plus pre-NFP drift (1.04) · month-end bond seasonality in 10-year futures (0.66) · regime-filtered metals skewness (0.98) · and the RSI(2) principle carried onto 2-hour/4-hour bars (1.18–1.25).
Read that list and notice what's not on it: not one classic chart pattern. Every survivor is either a structural or calendar flow — somebody has to trade at the weekly gold close, at month-end bond rebalancing, before scheduled Fed meetings, regardless of what the chart looks like — or a simple mean-reversion idea on a liquid, flow-driven market. Flows recur because they're driven by obligations, not opinions. Chart patterns fade because everyone can see them, and what everyone can see gets sold to everyone.
But here's the part that actually matters, and it's the opposite of what a "graveyard" article usually preaches. None of these survivors is spectacular. A 1.0–1.3 Sharpe is good, not magical. We're not hunting for the one perfect strategy — that hunt is exactly what fills graveyards, because a strategy that looks perfect is usually just overfit. The edge is in combination: a handful of merely-OK strategies that don't move together beats one brilliant strategy that can have a brilliant strategy's bad year. That's why the bar is so strict about correlation, and why "you already own that edge" is a valid rejection — a second copy of what you have adds risk, not diversification. The portfolio math is the whole game; the survivor list is just the raw material for it.
Three questions that kill most backtests in five minutes
- "Was any of this data unseen?" If the article can't point to a held-out window, assume the curve is fitted. We built the perfect backtest once — 2,160 parameter combinations — and watched it die on new data.
- "What did costs do?" Every number in our log charges real transaction costs; most published curves charge zero. Short-hold strategies flip sign on this alone.
- "How many variants were tried?" One reported result from hundreds of attempts is multiple-testing bias, and it's the default in strategy publishing. A plateau of neighboring settings that all work is the antidote — a lone magic parameter is a confession. And even a real edge only shows you one path of many: its drawdown distribution is wider than its history.
Lab notes
The graveyard nearly claimed us too. In April a metals gap-up strategy tested at Sharpe 1.80 with an 81% win rate — good enough that it was one review away from deployment. The bug: the entry condition accidentally referenced the same day's close, information you can't have at the open. Fixed, the Sharpe fell to 0.72 and a sister variant went negative. The whole version was rolled back and the incident is logged next to lesson #38 and friends in the master log. Rule since then: any result that looks too clean gets hunted for lookahead before it gets admired.
So take the title with the pinch of salt it deserves. This isn't a graveyard of 150 dead strategies — it's a smaller graveyard of genuinely arbitraged ones, surrounded by a much larger pile of edges that were real but redundant, or real but out of reach at our scale. The useful claim isn't "everything fails." It's this: chasing the one perfect, spectacular strategy is how you end up overfit and buried, while a stack of ordinary, uncorrelated edges quietly compounds. The survivor list isn't impressive one strategy at a time. It's not supposed to be.
Download a free strategy
Want the rules to one that survived? Simple and robust — 70% winners across 155 trades over 16 years, net of costs. The free PDF gives you the market, the timeframe and the exact rules in plain English, plus every single trade it has taken.
Instant delivery. One PDF, no spam. Unsubscribe anytime.
FAQ
Does Connors RSI(2) still work?
Depends which version. Plain RSI(2) dip-buying on liquid equity indices (QQQ/SPY) is alive — it cleared our bar at 1.20 OOS and it's the strategy we run the health-check tripwires on. What died is the fancier TPS scale-in variant on futures (0.96 in-sample → 0.006 out-of-sample) and RSI(2) on commodities. Same indicator, different jobs: one survived, others didn't.
Is the opening range breakout dead?
The naive version failed to beat a random-direction baseline. A 15-minute-formation ORB on regular-trading-hours data survived at 0.79–0.91 OOS. One implementation detail separates the corpse from the descendant.
What's the biggest reason published backtests fail re-testing?
In-sample survivorship: the curve was fitted or selected on the data it's shown on. Add zero costs and multiple-testing bias, and a book strategy can look spectacular for decades while earning nothing forward.
What do the survivors have in common?
They're structural or calendar flows (weekly gold close, month-end bond rebalancing, pre-FOMC drift) or regime-filtered simple ideas — almost never classic chart patterns. Flows recur because someone must transact regardless of price.

Robin Eriksson
Founder of EdgeLab. Five years of discretionary losses taught me to test everything — now I publish the strategies that survive. About me →
Related: Why your backtest passes — and your live account doesn't · Does the 200-day moving average work? Tested on five assets · When is a strategy dead? Three statistical tripwires we use