The short version: by raw return, bitcoin won by a mile — $10,000 became about $2.4 million (63% a year) from 2015–2026 — but with an -83% drawdown and a -74% year. The Nasdaq made 19% a year, the S&P 14%, gold 11%, and long bonds actually lost money. Rank by risk instead of raw return and the order barely changes — but here's the real finding: an equal-weight mix of all five beat every single asset on risk-adjusted return (Sharpe 1.33 vs bitcoin's 1.08), compounding at 25% a year. You didn't have to pick the winner. That's the whole point.
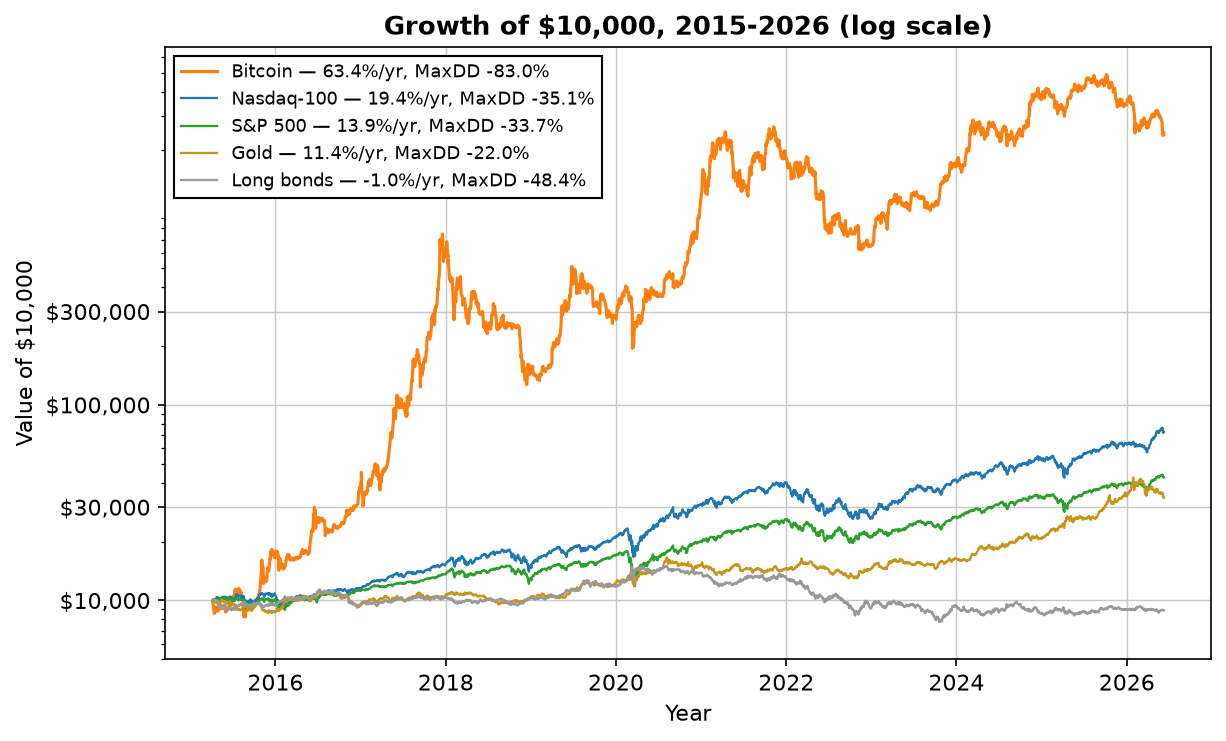
Let's start with the chart everyone actually wants — $10,000 put into each asset in 2015, on a log scale so you can see the losers as well as the winner:
By raw return, it's not close — and neither is the risk
Bitcoin's number is almost silly: a 63% compound annual return turns $10,000 into roughly $2.4 million. The Nasdaq-100 (19% a year) and S&P 500 (14%) are the familiar equity winners, gold delivered a respectable 11%, and long-term Treasuries — in the worst bond decade in a generation — lost about 1% a year. If the only column that mattered were return, you'd stop reading and buy bitcoin.
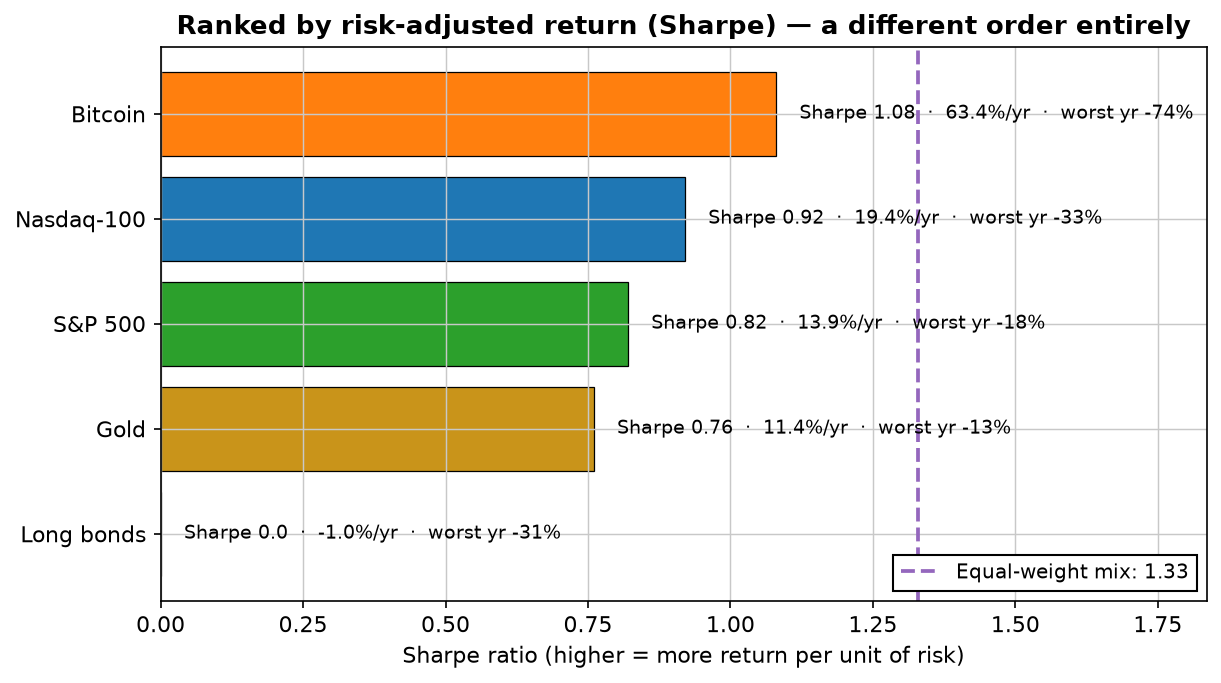
But every one of those returns was paid for in drawdown, and the bill varied wildly: bitcoin's worst drawdown was -83% (and one calendar year of -74%), versus -35% for the Nasdaq, -34% for the S&P, and just -22% for gold — the steadiest single asset of the group. The question isn't "which returned most." It's "which returned most per unit of risk you had to stomach," and that reshuffles the board:
The winner isn't an asset — it's the mix
That dashed line is an equal-weight portfolio of all five assets, rebalanced monthly. Its Sharpe ratio was 1.33 — higher than every single asset, including bitcoin — and it compounded at about 25% a year, second only to bitcoin itself. It did this while never being right about which asset would lead. It simply held a slice of each, and let the winners carry the losers.
How does a mix beat its own best component on risk-adjusted terms? Because the assets don't fall at the same time. When bitcoin was in an -83% hole, stocks and gold were doing other things; when bonds bled, equities and bitcoin were climbing. Blend return streams that zig and zag independently and the combination is smoother than any of its parts — the one genuinely free lunch in investing, and the subject of our portfolio-math article. Here's what it looks like where it matters most, in the drawdowns:
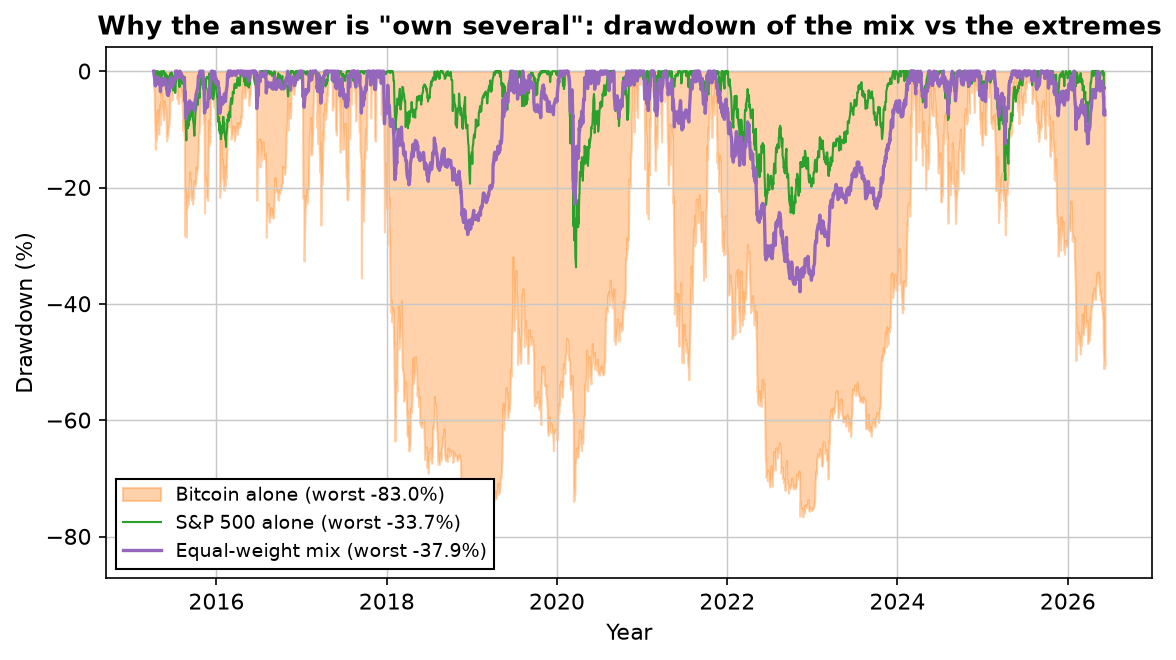
Be precise about what that chart says: the mix's drawdown (-38%) was actually a touch worse than the S&P alone (-34%) — because 2022 hit everything at once, the one thing diversification can't fully fix. But it earned 25% a year for that risk versus the S&P's 14%. You didn't get a free ride; you got a much better rate for the ride you took.
Why "buy the winner" is the wrong lesson
The strongest reason not to just buy bitcoin — or whatever tops your ten-year chart — is hiding in the setup. This window started near a bitcoin low, which flatters it enormously, and it spanned the worst decade for bonds in fifty years, which makes them look permanently broken. Neither is a law of nature. Rankings like this are shaped as much by their start and end dates as by the assets themselves, which is exactly why chasing the last decade's champion is a bet that the next decade rhymes. It rarely does. The diversified mix won here without needing to guess which asset would lead — and that robustness, not any single number, is the reason it's the honest answer to "what should I have owned."
Lab notes
I set the start date at April 2015 not by choice but because that's where bitcoin's data begins in my frozen cache — and I want to flag how much that single decision drives the story. Start in 2018 instead and bitcoin's -74% first year would gut its ranking; start in 2011 and it'd be even more absurd. There's no neutral window for an asset that went from pennies to six figures, which is itself the lesson: be suspicious of any "best asset" list that doesn't tell you exactly when it started counting. Everything here is buy-and-hold with dividends included and no trading costs, since these are holds, not strategies — the equal-weight mix pays a little for monthly rebalancing, which I've left out as immaterial at this scale.
Download a free strategy
Simple and robust — 70% winners across 155 trades over 16 years, net of costs. The free PDF gives you the market, the timeframe and the exact rules in plain English, plus every single trade it has taken.
Instant delivery. One PDF, no spam. Unsubscribe anytime.
FAQ
What was the best performing asset of the last decade?
Bitcoin, by raw return, by miles: $10,000 became ~$2.4M from 2015–2026 (63% a year) vs ~19% for the Nasdaq, ~14% for the S&P, ~11% for gold, and -1% for long bonds. But bitcoin's worst drawdown was -83% and its worst year -74%, so "best" hinges on whether you could hold it.
Is bitcoin or the S&P 500 better?
Different yardsticks. Bitcoin 63%/yr vs S&P 14%, but bitcoin drew down -83% (worst year -74%) vs the S&P's -34% (-18%). Risk-adjusted, bitcoin still edged ahead (Sharpe 1.08 vs 0.82) — a far smaller gap than the raw-return one.
What's the best risk-adjusted asset?
No single one — an equal-weight mix of all five, rebalanced monthly, had a higher Sharpe (1.33) than any asset including bitcoin (1.08), compounding ~25% a year. Diversification beat picking the winner on return per unit of risk.
Should I just buy whichever asset performed best?
That's the trap. The ranking is shaped by its window — it started near a bitcoin low and spanned the worst bond decade in fifty years. Buying last decade's winner bets the next rhymes; owning a diversified set and rebalancing removes the need to guess.

Robin Eriksson
Founder of EdgeLab. Five years of discretionary losses taught me to test everything — now I publish the strategies that survive. About me →
Related: How many trading strategies do you need? The portfolio math · ETF momentum rotation: rules, 21 years of data — and an honest verdict · Darwinex Zero for systematic traders: the platform that pays for Sharpe