The short version: 2–4 genuinely uncorrelated strategies capture most of what diversification has to give. The jump from one strategy to two is the single biggest upgrade available in systematic trading (~40% more Sharpe in theory — our real pair delivered almost exactly that). After four, each addition helps less while genuine uncorrelation gets much harder to find. Correlation, not count, is the variable that decides everything.
The formula
For N strategies at equal weight, each with Sharpe ratio S and average pairwise correlation ρ between them:
Portfolio Sharpe = S × √( N / (1 + (N−1) × ρ) )
Two consequences hide in there. With ρ = 0, the Sharpe grows like √N — strategy two multiplies it by 1.41, strategy three by another 1.22, strategy four by 1.15. Diminishing, but real. The second consequence is the one that matters: correlation puts a hard ceiling on the whole project. At ρ = 0.5, even an infinite number of strategies can't lift the portfolio Sharpe above 1.41 × S. At ρ = 0.9, twenty strategies are barely better than one:
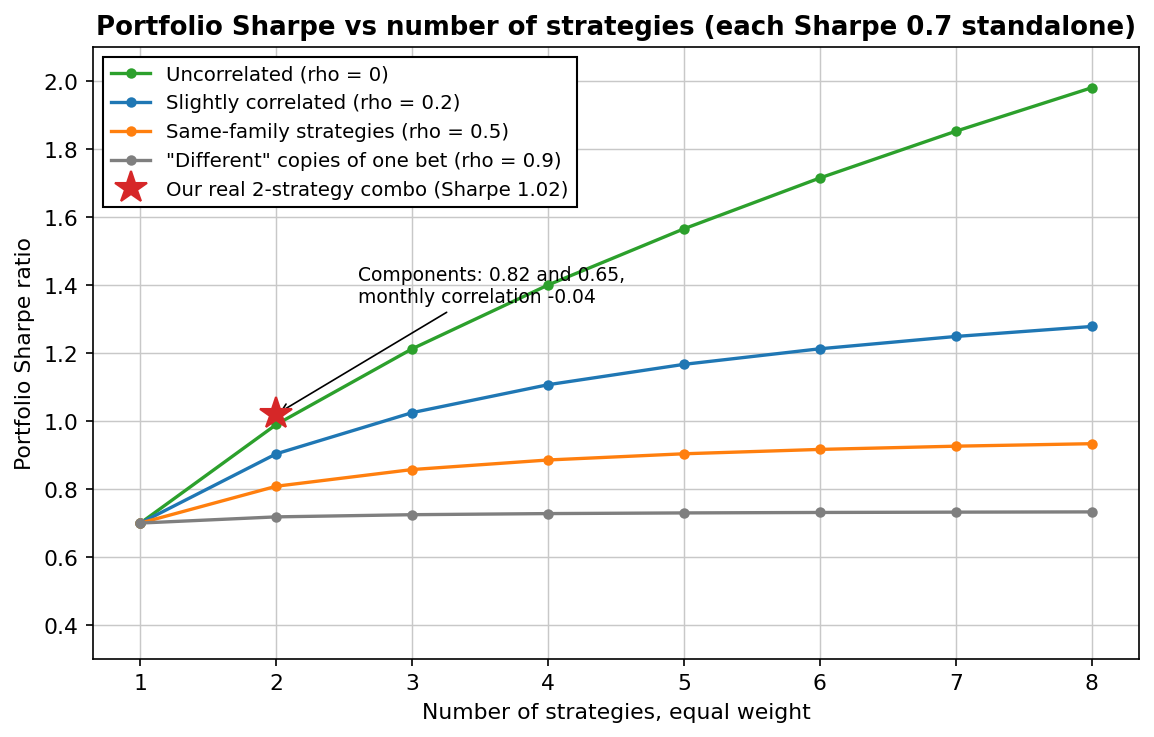
That red star is the honest headline of this article. Our Strategy 1 (short-term mean reversion on stock indices) runs a 0.82 Sharpe alone; our Strategy 2 (long-term trend on gold) runs 0.65. Their monthly correlation since 2005 is -0.04 — statistically, strangers. Split 50/50 and rebalanced monthly, the measured combination: Sharpe 1.02. The boring formula predicted it within two hundredths.
What the upgrade feels like: drawdowns
Sharpe is abstract. Here's the same 21 years drawn as what you'd actually live through — every day spent below a previous account high:
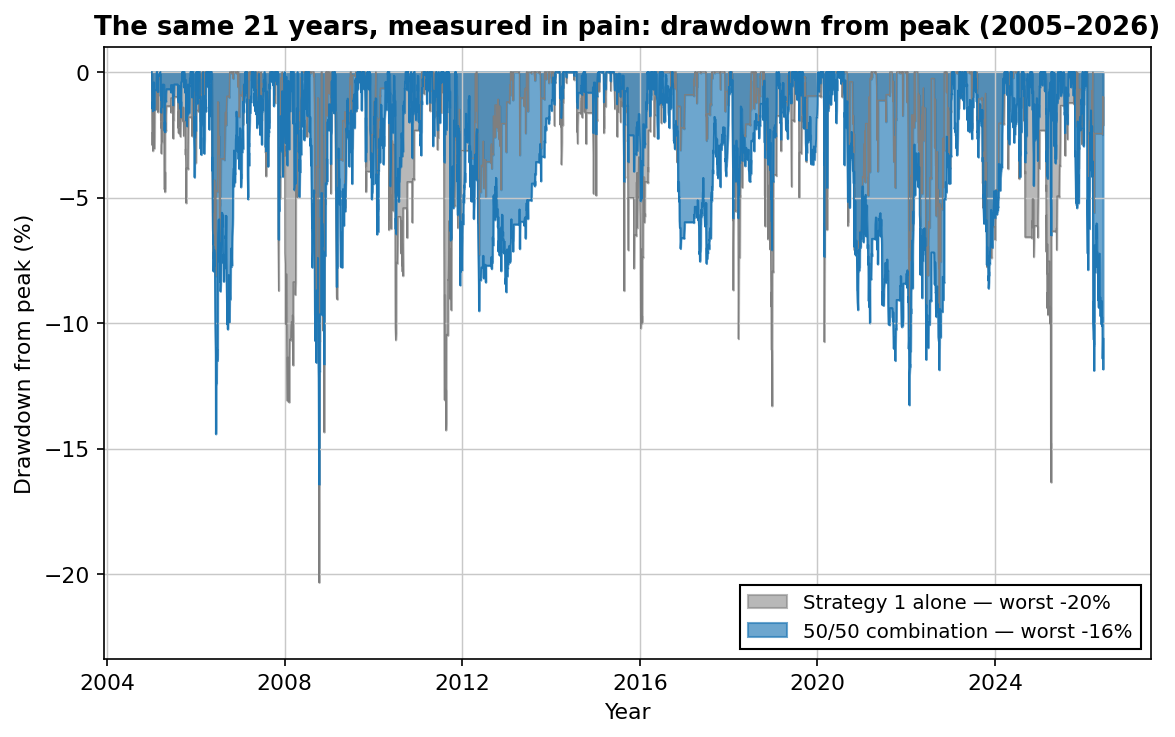
And here's why that's worth paying a little CAGR for (the combination earns 10.6% vs 11.2% for Strategy 1 alone): your position size is set by the worst drawdown you can survive, financially and psychologically. A strategy that's 20% calmer at the worst moment can be sized up. Run the combination at 1.25x and you're back at Strategy 1's pain level — earning roughly 13% a year instead of 11%. Same worst case, more return. It's the closest thing to a free lunch this business offers, and it's the entire reason the strategies we give subscribers are designed as a pair.
The correlation trap
So why doesn't everyone just run ten strategies? Because of what people count as "different". Five dip-buying systems on SPY, QQQ, IWM, DAX and Nikkei are not five strategies — they're one bet (equity mean reversion) wearing five hats, with pairwise correlations of 0.7–0.9. The gray curve in the first chart is their ceiling: barely better than one strategy, with five times the operational complexity.
Genuine uncorrelation almost always requires changing both the mechanism and the asset. Mean reversion harvests panic over days; trend following harvests persistence over months; they're answering different questions, and on different asset classes they're answering them about different things. That's the design behind our pair — and it's why the correlation is -0.04 rather than 0.5.
One honest warning from our own research process: most candidate strategies fail testing — more than 80% in our case. Sourcing four genuinely different, genuinely robust edges is years of work, not a weekend. Which leads to the practical answer.
So how many?
| Going from… | Theoretical Sharpe gain (ρ=0) | The honest catch |
|---|---|---|
| 1 → 2 strategies | +41% | None. Do this first; it's the biggest upgrade available. |
| 2 → 3 | +22% | The third genuinely different edge is already hard to find. |
| 3 → 4 | +15% | Worth it if the edge is real — never for diversification theater. |
| 4 → 8 | +41% (cumulative) | Requires mechanisms most private traders can't access; correlation creep usually eats the theory. |
Our position: two is the minimum responsible setup, four is plenty. Past that, every addition tends to be a worse version of something you already own — and a portfolio of near-duplicates gives you the ceiling of the orange curve while feeling like the green one. Three exceptional strategies beat twenty mediocre ones, every time.
On weights: equal weight, rebalanced monthly, is embarrassingly hard to beat. We've tested inverse-volatility and concentration schemes on rotation systems — they looked clever and did nothing. Complexity in the weighting layer is usually curve fitting with extra steps.
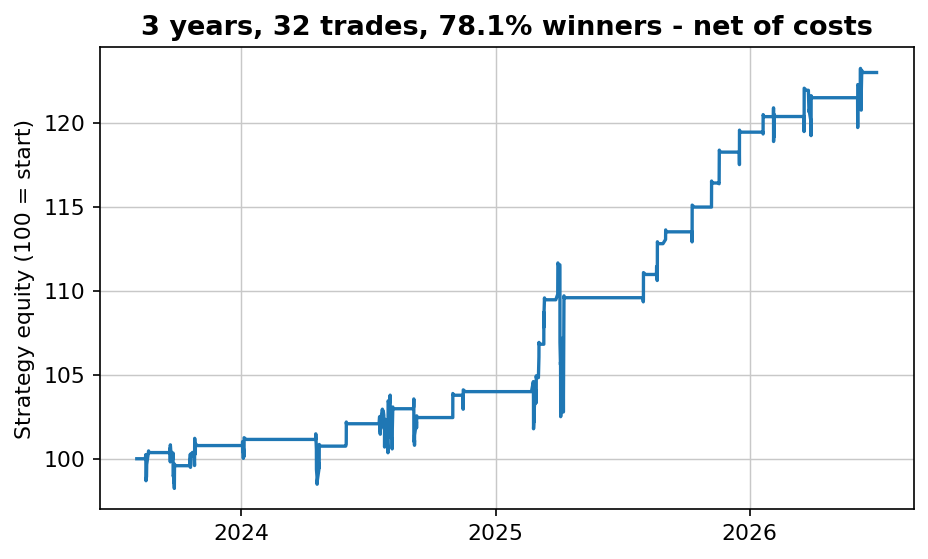
Start with one tested edge — free
Join the list and get the free strategy report today: the market, the timeframe and the exact rules in plain English, every trade shown, net of costs — a first building block for the portfolio math in this article.
No spam. Unsubscribe anytime.
FAQ
How many strategies should a retail trader run?
Two to four genuinely uncorrelated ones. The first addition is the big win (+41% Sharpe in theory, +24% measured in our real pair); by the fourth, marginal gains are small and sourcing real edges is the constraint.
Does combining strategies lower returns?
Slightly, at equal size — our combo earns 10.6% vs 11.2% for the better strategy alone. But the calmer drawdown profile lets you size the combination up: at matched worst-case pain it earns roughly 13%. Risk-adjusted, combining won by a wide margin.
What correlation is low enough?
Below ~0.2 monthly is excellent; ours is -0.04. At 0.5, the diversification benefit caps out fast no matter how many strategies you add — check the formula before adding strategy number six.
Is it better to perfect one strategy instead?
Improving a strategy's Sharpe from 0.8 to 1.0 is years of work and usually ends in overfitting. Adding an uncorrelated 0.65-Sharpe strategy achieved the same portfolio result in our data — diversification is the cheaper mile.

Robin Eriksson
Founder of EdgeLab. Five years of discretionary losses taught me to test everything — now I publish the strategies that survive. About me →
Related: SPY vs QQQ vs gold vs bitcoin: the best asset, risk-adjusted · ETF momentum rotation: rules, 21 years of data — and an honest verdict · Toby Crabel's NR7 breakout, tested on stocks, gold and bitcoin — 1,850 trades