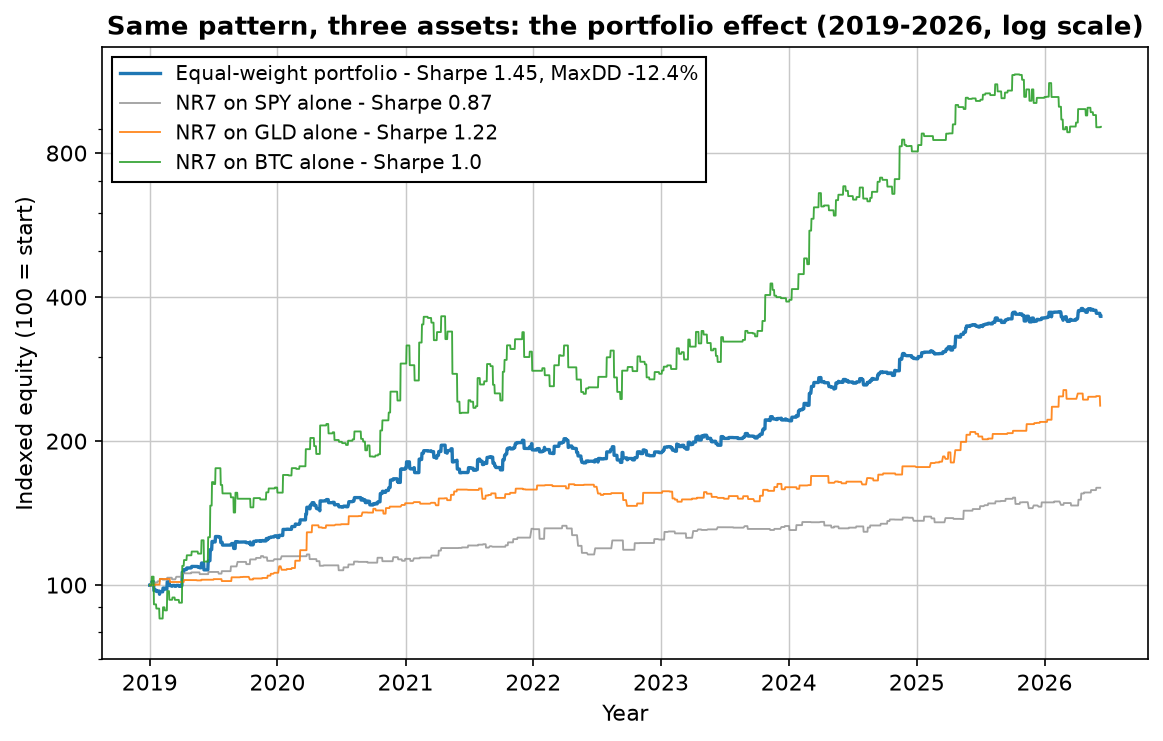
The short version: the NR7 breakout — buy a stop above the close after an unusually quiet day — earned an out-of-sample Sharpe of 0.87 on SPY, 0.80 on QQQ, 1.22 on gold and 1.00 on bitcoin (2019–2026, 0.05% per side), improving on its in-sample numbers everywhere except bitcoin. On stocks alone that loses to buy-and-hold. But the three streams are essentially uncorrelated, and the equal-weight combination earned 19.0% a year at Sharpe 1.45 with a -12.4% max drawdown — a better risk-adjusted result than the pattern on any single asset, or than holding any of them. The edge isn't in the pattern. It's in the portfolio.
The rules — all of them
From Toby Crabel's Day Trading With Short Term Price Patterns and Opening Range Breakout (1990) — long out of print, widely photocopied, and one of the most cited pattern books in systematic trading. We test the long side, daily bars:
- Setup: today is an NR7 — the narrowest high-to-low range of the last 7 days — or an inside day that is also the narrowest of 4 (Crabel's "IDnr4").
- Entry: tomorrow, a buy stop at today's close + the Stretch. The Stretch is the 10-day average of min(|Open−High|, |Open−Low|). If the stop isn't hit, there is no trade.
- Exit: at the close three days after entry. No stop-loss, no targets, no overlapping trades.
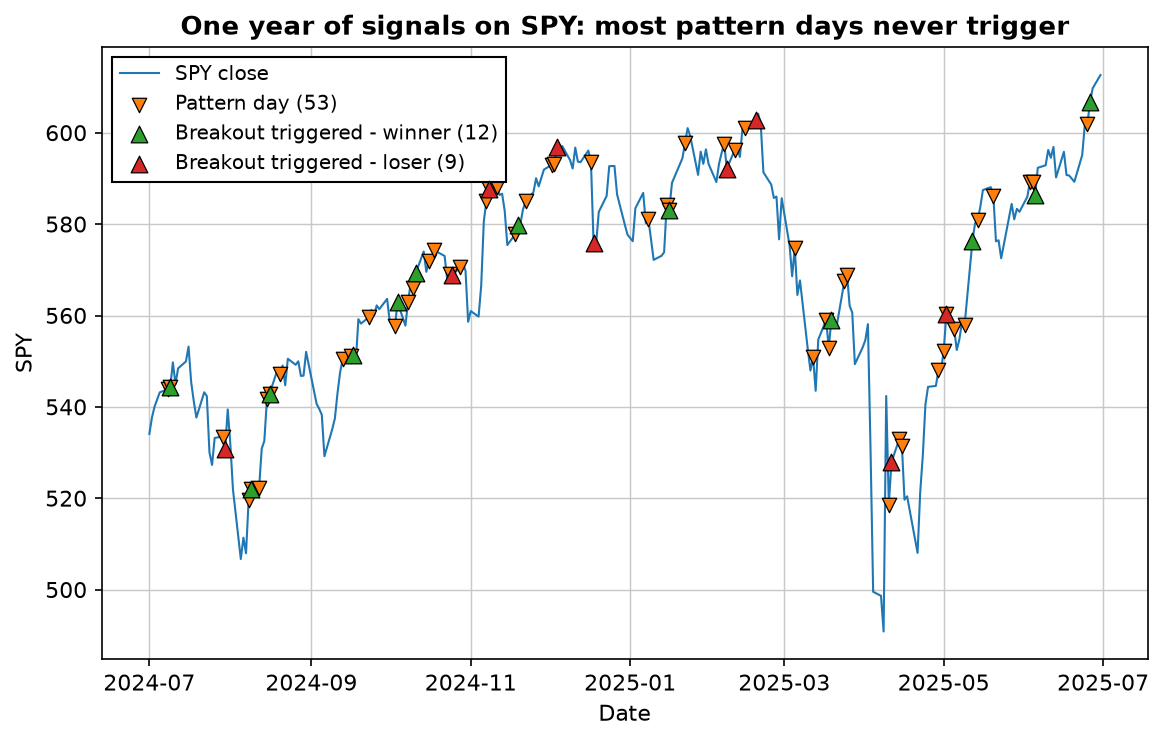
The logic: volatility contracts before it expands. A very quiet day is a coiled spring, and the stop order means you only pay for the trade when the spring actually releases upward. That conditional entry matters more than it looks:
Four assets, identical rules, zero re-tuning
Same code, same parameters, four instruments from our frozen data cache: SPY and QQQ from 2003, gold (GLD) from 2004, bitcoin from 2015. In-sample ends 2018; everything after 1 January 2019 is out-of-sample. All results net of 0.05% per side:
| SPY | QQQ | GLD | BTC | |
|---|---|---|---|---|
| Sharpe, in-sample | 0.46 | 0.64 | 0.96 | 1.48 |
| Sharpe, out-of-sample | 0.87 | 0.80 | 1.22 | 1.00 |
| CAGR, out-of-sample | 6.5% | 8.8% | 12.3% | 34.5% |
| Max drawdown, OOS | -12.9% | -19.2% | -9.9% | -37.3% |
| Trades, OOS | 148 | 164 | 157 | 263 |
| Win rate, OOS | 63.5% | 58.5% | 62.4% | 52.1% |
| Time in market | ~24% | ~25% | ~24% | ~29% |
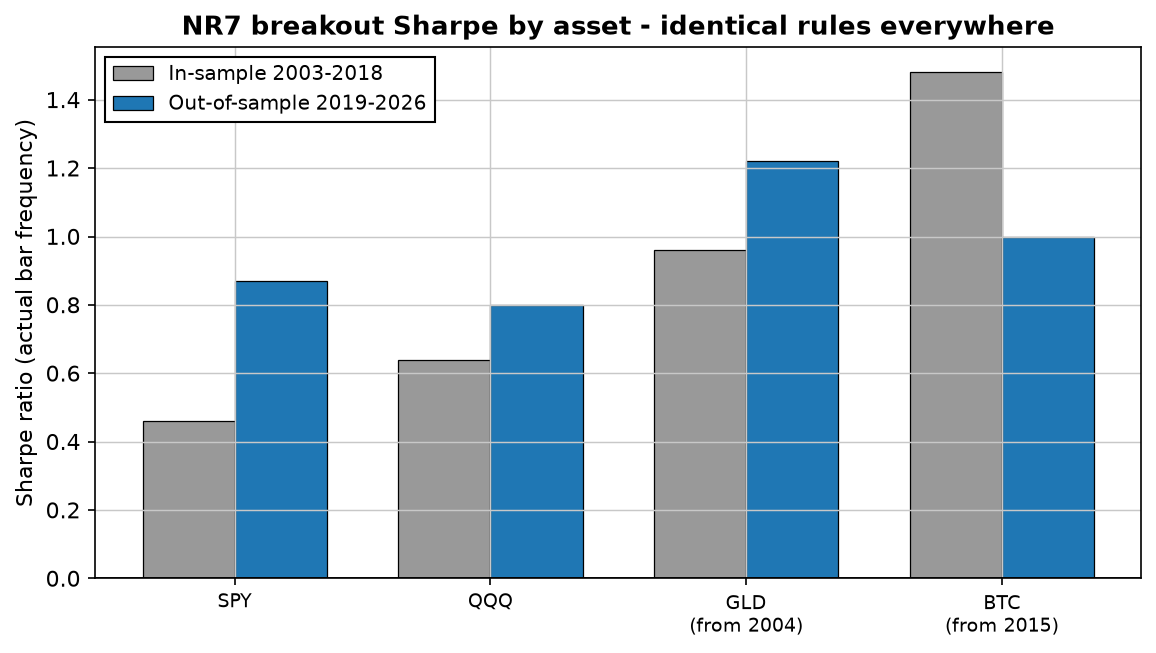
Read that table like a skeptic, the way we read every backtest. Sharpe is annualised with each asset's actual bar frequency — bitcoin trades seven days a week, and using √252 on it quietly inflates the number. That correction is also why you may see NR7 portfolios quoted near Sharpe 2 elsewhere; on our math, with honest annualisation, the right answer is lower. Still good — just honest.
The honest part: it loses to buy-and-hold on stocks
Out-of-sample buy-and-hold SPY returned 17.4% a year at Sharpe 0.92 — through a -33.7% drawdown. NR7 on SPY made 6.5% at 0.87 with a third of the drawdown. Risk-adjusted it's a coin flip, and in raw return it's not close: 2019–2026 was a relentless bull market, and a strategy that's only in the market 24% of the time cannot keep up with a rocket. If your benchmark is "beat the index with one pattern on one stock ETF," this fails it, and any honest write-up should say so.
What the single-asset numbers actually show is a persistent, tradable micro-edge: an average of +0.33% per trade on SPY across 148 out-of-sample trades, +0.57% on gold, +1.01% on bitcoin. Small, positive, repeated — and paid out over just three days of market exposure per trade. The question is never whether a 0.87-Sharpe component beats the index. It's what happens when you own three of them that don't move together.
The portfolio effect: same pattern, three markets
Here are the weekly correlations between the three NR7 return streams, 2015–2026:
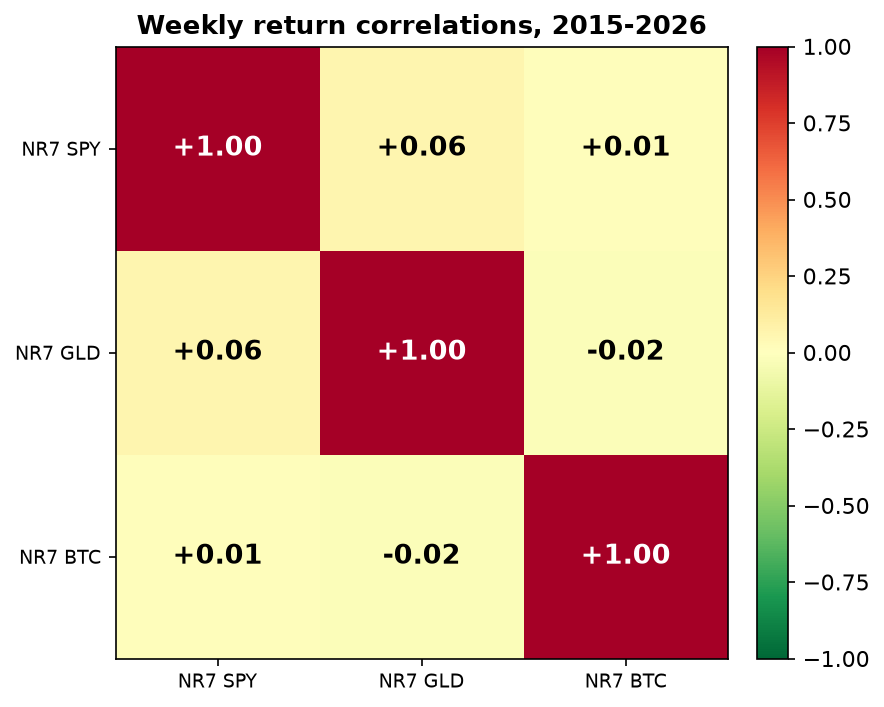
The reason is mechanical: the strategy is in each market only ~24% of the time, and quiet-day clusters on the Nasdaq have nothing to do with quiet-day clusters in gold or bitcoin. The trades barely overlap. That's what produces the curve at the top of this article: an equal-weight book — a third of capital per stream, net of the same costs — compounding at 19.0% with a worst drawdown of -12.4%. No single stream has a Sharpe above 1.22; the combination reaches 1.45.
Two honest notes on that chart. First, a large share of the raw return comes from the bitcoin sleeve — that's what a 34% CAGR component does to an equal-weight book, and if you can't stomach any bitcoin exposure, the SPY+GLD version is tamer in both return and Sharpe. Second, "equal weight" means rebalancing: without periodic rebalancing the bitcoin sleeve would quietly take over the book, and you'd own its -37% drawdowns at triple weight precisely when they arrive.
Where it fits
NR7 is a textbook example of what we keep finding: the edge that survives testing is rarely the strategy — it's the combination. One quiet-day breakout on one index is a 0.8-Sharpe tactic that trails buy-and-hold. The same tactic across three unrelated markets, sized evenly and rebalanced, is a 1.45-Sharpe book with a drawdown most investors could actually live through. That's the same conclusion as our portfolio-math article, arrived at from a completely different direction — and it's the design principle behind everything we publish.
Download the free strategy report
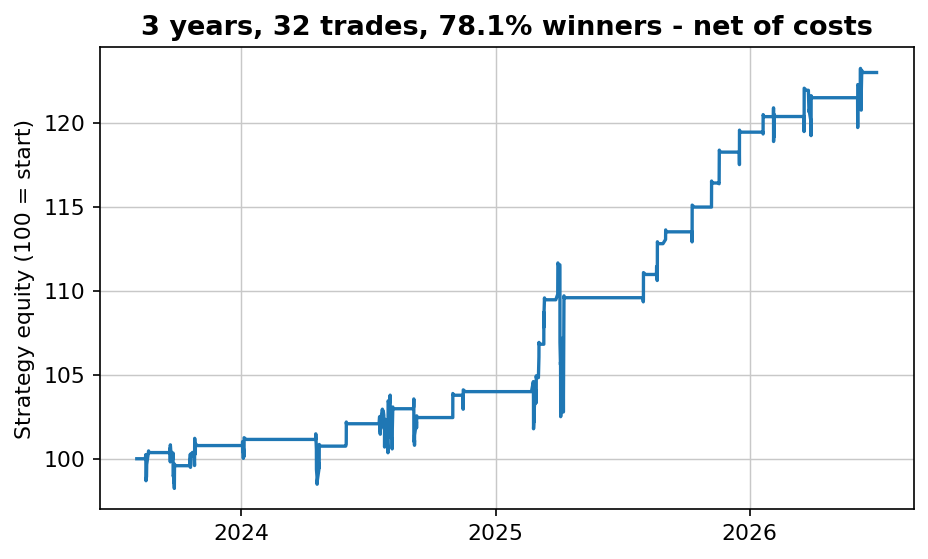
Simple and robust — 70% winners across 155 trades over 16 years, net of costs. The free PDF gives you the market, the timeframe and the exact rules in plain English, plus every single trade it has taken.
Instant delivery. One PDF, no spam. Unsubscribe anytime.
FAQ
What is the NR7 pattern?
A day whose high-to-low range is the narrowest of the last seven trading days. In Crabel's framework, volatility contraction precedes expansion — the quiet day is the setup, and the next day's breakout is caught with a stop order above the close.
Does the NR7 breakout strategy still work?
Depends what you ask of it. Out-of-sample (2019–2026, net of costs): Sharpe 0.87 on SPY — just below buy-and-hold — but 1.22 on gold and 1.00 on bitcoin with far smaller drawdowns than holding. Sharpe improved out-of-sample on three of four assets. Alive, yes; a standalone stock-market system, no.
What is Crabel's Stretch?
The entry offset: the 10-day average of min(|Open−High|, |Open−Low|). The buy stop sits at the previous close plus the Stretch, so you only trade when the market actually expands — about 60% of pattern days never trigger.
Why run the same strategy on three assets at once?
The three streams are essentially uncorrelated (+0.06, +0.01, −0.02 weekly, 2015–2026). Equal-weight, the combination earned 19% a year at Sharpe 1.45 with a -12.4% max drawdown — better risk-adjusted than any single stream or any of the three held passively.

Robin Eriksson
Founder of EdgeLab. Five years of discretionary losses taught me to test everything — now I publish the strategies that survive. About me →
Related: The Friday gold effect: a real pattern you probably can't trade · SPY vs QQQ vs gold vs bitcoin: the best asset, risk-adjusted · Does "sell in May and go away" work? 33 years of SPY, tested