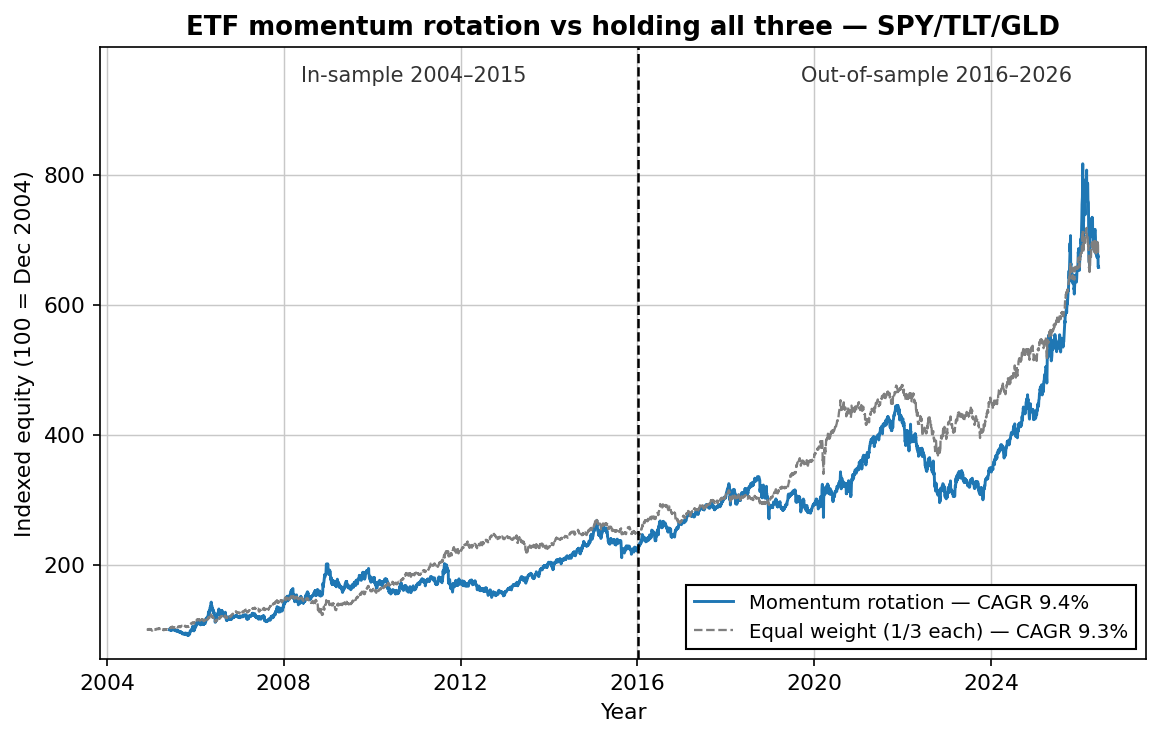
The short version: momentum rotation across SPY, TLT and GLD returned 10.9% a year out-of-sample (2016–2026) with roughly three trades per year. But here's what the sales pages skip: over the full 21 years it earned about the same as just holding all three ETFs (9.4% vs 9.3%) — with a deeper max drawdown and a much lower Sharpe ratio (0.61 vs 0.96). Momentum is real. Winner-take-all rotation on three assets is a blunt way to harvest it.
The rules
ETF momentum rotation — complete rules
- Universe: SPY (US stocks), TLT (20+ year Treasuries), GLD (gold).
- On the last trading day of each month: rank all three by their trailing 6-month total return.
- Hold the winner — 100% — for the following month. Repeat.
One parameter (the 6-month lookback), one decision a month, about three actual switches a year. The academic backing is real: cross-asset momentum is one of the most documented effects in finance. The question isn't whether momentum exists — it's whether this way of harvesting it is worth the drawdowns.
What it actually held
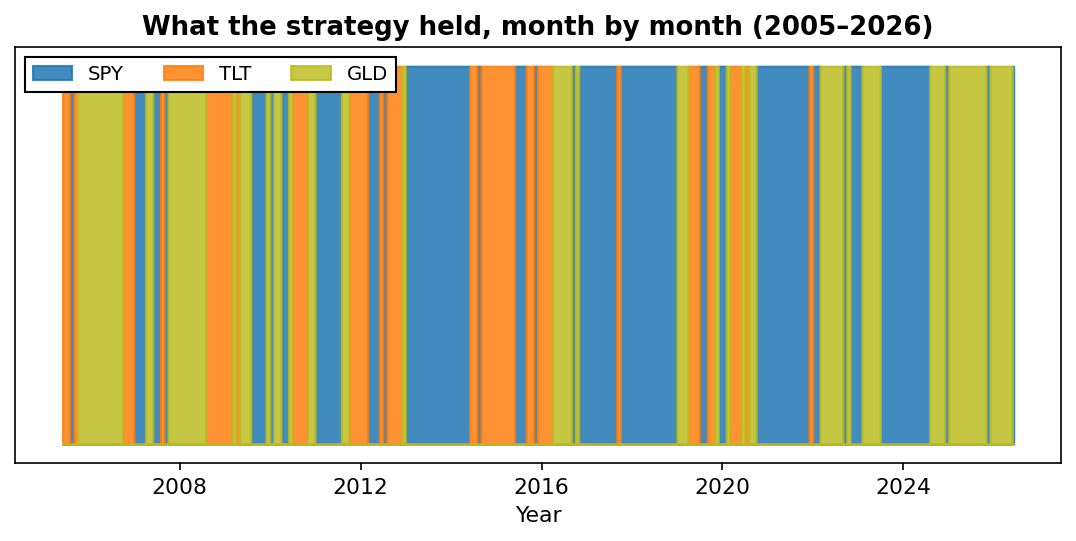
Before the numbers, it helps to see the strategy's life: long stretches in one asset, punctuated by clusters of indecision. The gold-heavy right edge is 2024–2026, when gold's trend dominated everything else:
The numbers
| Metric | In-sample (2005–2015) | Out-of-sample (2016–2026) | Equal weight (full period) |
|---|---|---|---|
| CAGR | 7.8% | 10.9% | 9.3% |
| Sharpe ratio | 0.52 | 0.70 | 0.96 |
| Max drawdown | -25.8% | -33.6% | -22.7% |
Two things stand out. The out-of-sample decade was better than the development period — 2016–2026 contained exceptional trends in both stocks and gold, ideal conditions for momentum. And the equal-weight benchmark, which requires zero decisions, beat the strategy on every risk-adjusted measure.
We tried to fix it. Here's what actually happened.
An honest test doesn't stop at the base case, so we ran three common "improvements" on the same 21 years:
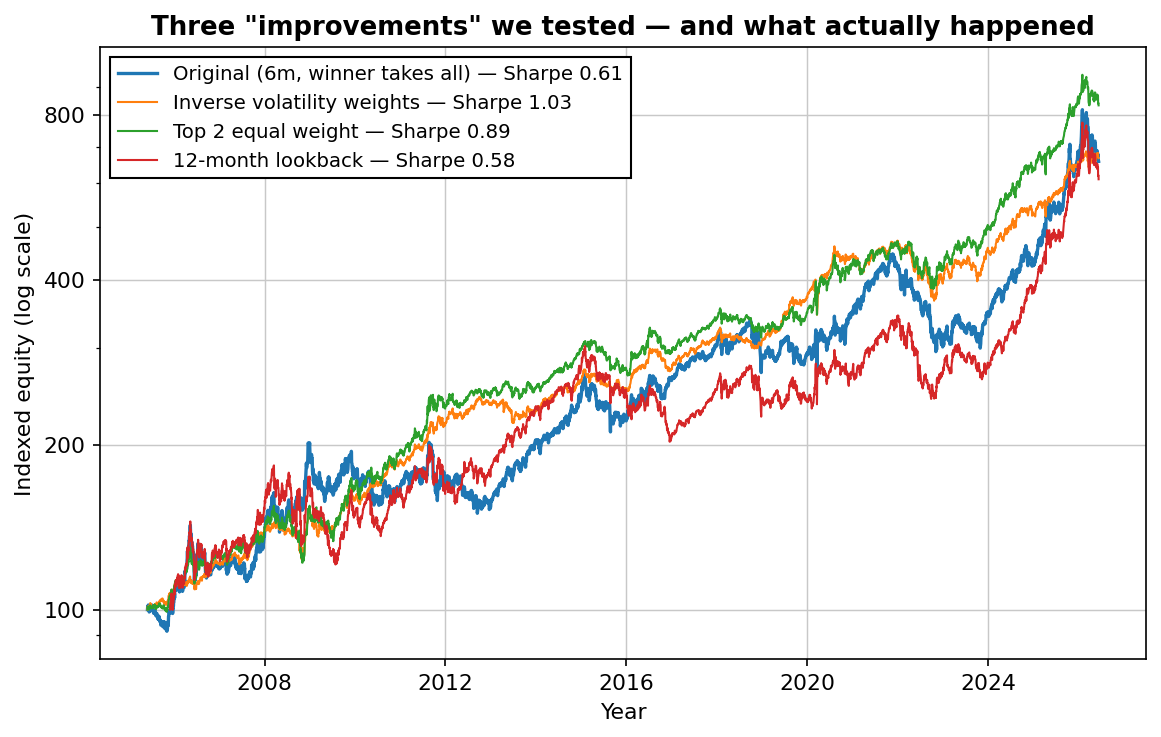
- 12-month lookback: worse on every metric (Sharpe 0.58, MaxDD -34%). The classic academic lookback didn't help here.
- Top 2 instead of winner-take-all: Sharpe jumps to 0.89, drawdown shrinks to -21%. Better!
- Inverse-volatility weights across all three: Sharpe 1.03 — the best of everything we tested.
But notice what those last two actually do: they reduce the concentration. Each step toward "better" is a step away from momentum and toward the diversified benchmark — which sits at Sharpe 0.96 with no strategy at all. We expected inverse-volatility weighting to be a refinement of the momentum edge. What we found is that it mostly replaces the momentum edge with a diversification edge. That was the genuinely useful surprise of this test.
The more we "improved" the rotation, the more it converged on the portfolio you could have held without any strategy at all.
So is it worth trading?
Our honest read, in three parts:
1. As a standalone strategy — no. A -34% drawdown for benchmark-level returns is a bad trade psychologically and financially. Most people abandon a strategy long before -34%.
2. As a building block — maybe. Its returns correlate weakly with short-term mean reversion strategies, which is what a portfolio actually needs. Sized at a fraction of a portfolio next to uncorrelated systems, the rotation's trend exposure earns its place. That's how we'd use it — and why we test everything against held-out data first.
3. As a lesson — absolutely. This test is the cleanest demonstration we have that "beats buy and hold" claims need a fair benchmark. The right comparison for a rotation strategy isn't SPY. It's holding the same universe, untouched.
How to trade it (if you do)
- Last trading day of the month, after the close: compute 6-month total returns for SPY, TLT, GLD.
- If the winner differs from what you hold, switch at the next open (or close).
- Use a tax-advantaged account — every switch realizes gains.
- Size it as a sleeve, not the whole portfolio. We'd cap it at 20–30%.
The full PDF report — free, no email needed
The complete analysis — sensitivity sweep, Monte Carlo simulation, asset-allocation breakdowns and methodology notes.
Want a strategy in your inbox instead? Download the free strategy — every trade shown.
FAQ
Does ETF momentum rotation beat buy and hold?
In our 21-year test, it returned 9.4% a year versus 9.3% for holding all three ETFs untouched — but with a deeper max drawdown (-34% vs -23%) and a much lower Sharpe ratio (0.61 vs 0.96). On raw return, roughly a tie. Risk-adjusted, the benchmark won.
What lookback period works best?
Six months performed best of what we tested; twelve months was slightly worse everywhere. The gap is small enough to be noise — which is itself useful information. A strategy that only works at one magic lookback is curve fitting.
How often does it trade?
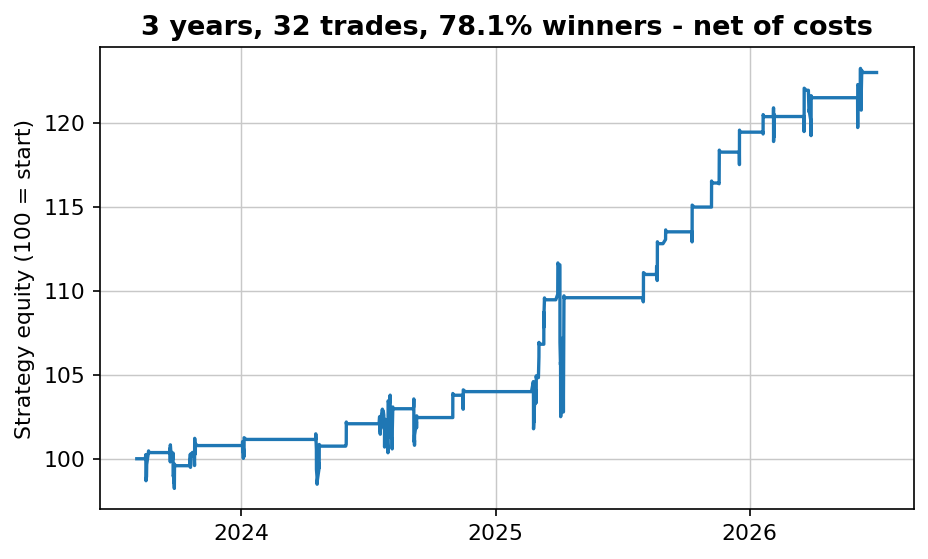
About three switches per year out-of-sample (32 in 10.5 years). Most month-ends you check the ranking and do nothing.
Is it tax-efficient?
No — every switch realizes gains. In a taxable account, the after-tax gap to buy-and-hold widens further.

Robin Eriksson
Founder of EdgeLab. Five years of discretionary losses taught me to test everything — now I publish the strategies that survive. About me →
Related: SPY vs QQQ vs gold vs bitcoin: the best asset, risk-adjusted · How many trading strategies do you need? The portfolio math · Zarattini's intraday momentum on the Nasdaq: the long side survives, the short side is a mirage