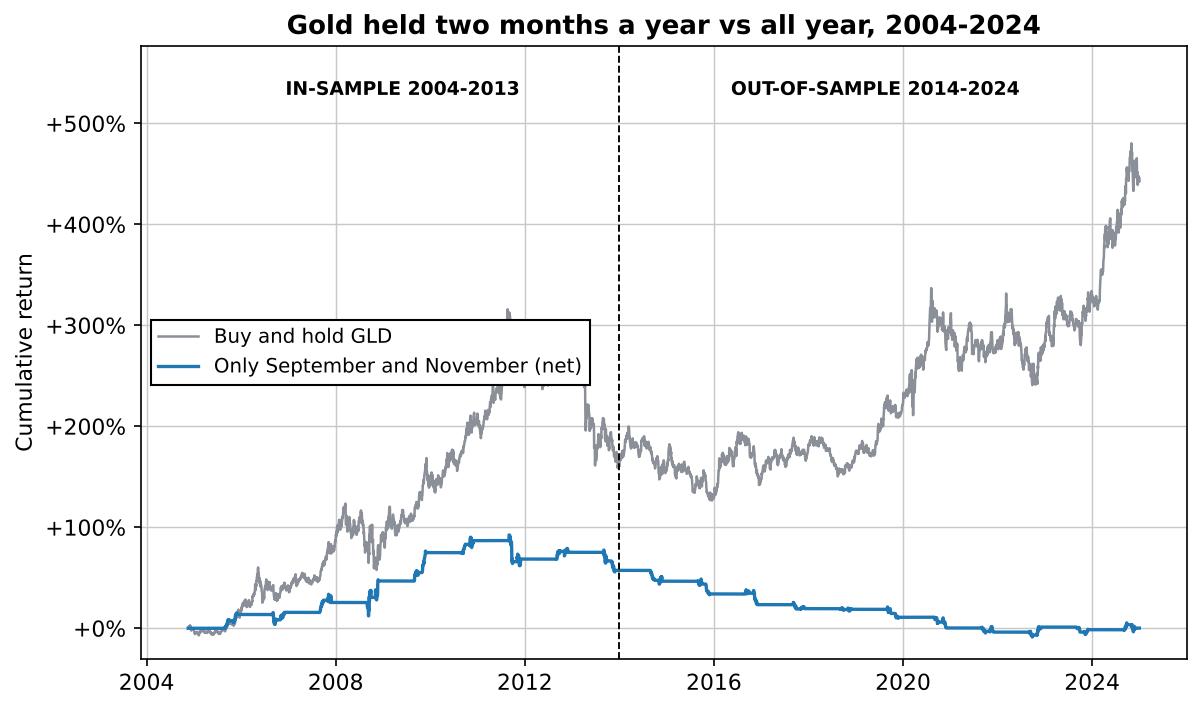
The short version: it no longer works. From 2005 to 2013, holding GLD only in September and November won 66.7% of its trades and averaged +2.75% per trade after costs. From 2014 to 2024 it won 27.3%, averaged -1.96%, and its Sharpe was -0.69, against a pre-registered line of 0.6. After 2013, September was gold's worst month of the twelve and November its second worst. And one honest catch: it is two trades a year, so neither the old result nor the new one proves as much as it looks.
One paper, two months, and a rule written down first
The source is Baur, D. G. (2013), The autumn effect of gold, Research in International Business and Finance 27(1), 1-11. The paper found that gold's returns in September and November stood out from the other months. The explanation usually given is demand for gold jewellery ahead of the festival and wedding season in India. Whatever the cause, the rule that falls out of it is about as simple as trading gets:
- Buy GLD at the close of the last trading day of August; sell at the close of the last trading day of September.
- Buy again at the close of the last trading day of October; sell at the close of the last trading day of November.
Flat the rest of the year, no stop. The test was registered on 2026-11-15: GLD only, in-sample to the end of 2013 (GLD starts in November 2004, so the first autumn traded is 2005), out-of-sample 2014 to 2024. Costs of 0.05% per side. The failure line: an out-of-sample Sharpe below 0.6 means the effect did not survive publication, and the article then has to show September and November year by year. It also has to show what the boundaries do if you move them, which comes later. First, the result.
It worked until the paper came out, then it reversed
| GLD, net of costs | In-sample 2005-2013 | Out-of-sample 2014-2024 |
|---|---|---|
| Trades | 18 | 22 |
| Win rate | 66.7% | 27.3% |
| Average trade | +2.75% | -1.96% |
| Median trade | +4.29% | -3.11% |
| Best / worst trade | +12.69% / -11.16% | +8.39% / -8.46% |
| Profit factor | 2.73 | 0.28 |
| Total return | +57.3% | -36.4% |
| CAGR | +5.10% | -4.03% |
| Max drawdown | -19.1% | -42.0% |
| Time in market | 16.0% | 16.3% |
| Sharpe (daily, annualised) | 0.55 | -0.69 |
| Buy and hold GLD: Sharpe / total return / max drawdown | 0.61 / +161.6% / -37.8% | 0.54 / +108.5% / -24.5% |
Before 2014 the two months together made money in 7 of 9 years. After, in 2 of 11. Gold itself did fine in the second period, +108.5% for buy and hold, so this is not a story about a bad market for gold. The two months the rule picked were simply the wrong ones.
Two things about the numbers are worth knowing before you read too much into them. First, even the in-sample Sharpe of 0.55 was below the 0.6 line. That is partly how Sharpe works for a strategy that sits in cash most of the year: the empty days pull it down roughly by the square root of the share of days invested. On its invested days alone, the in-sample Sharpe was 1.40. After 2013 that number was -1.67, so the conclusion doesn't depend on the yardstick. Second, the t-statistic of the in-sample trades was 1.79, short of the usual bar of about 2, and out of sample it was -2.37. Twenty-two trades can't carry much weight, but they point the other way. The line was crossed, so here is every year, as the registration requires.
September lost in 9 of 11 years after 2013
| Year | September trade | November trade | Both together |
|---|---|---|---|
| 2014 | -6.28% | -0.59% | -6.83% |
| 2015 | -1.90% | -6.85% | -8.62% |
| 2016 | +0.59% | -8.46% | -7.92% |
| 2017 | -3.47% | +0.26% | -3.22% |
| 2018 | -0.76% | +0.24% | -0.52% |
| 2019 | -3.49% | -3.31% | -6.68% |
| 2020 | -4.27% | -5.51% | -9.54% |
| 2021 | -3.32% | -0.79% | -4.08% |
| 2022 | -2.99% | +8.39% | +5.15% |
| 2023 | -4.86% | +2.43% | -2.55% |
| 2024 | +4.99% | -3.22% | +1.61% |
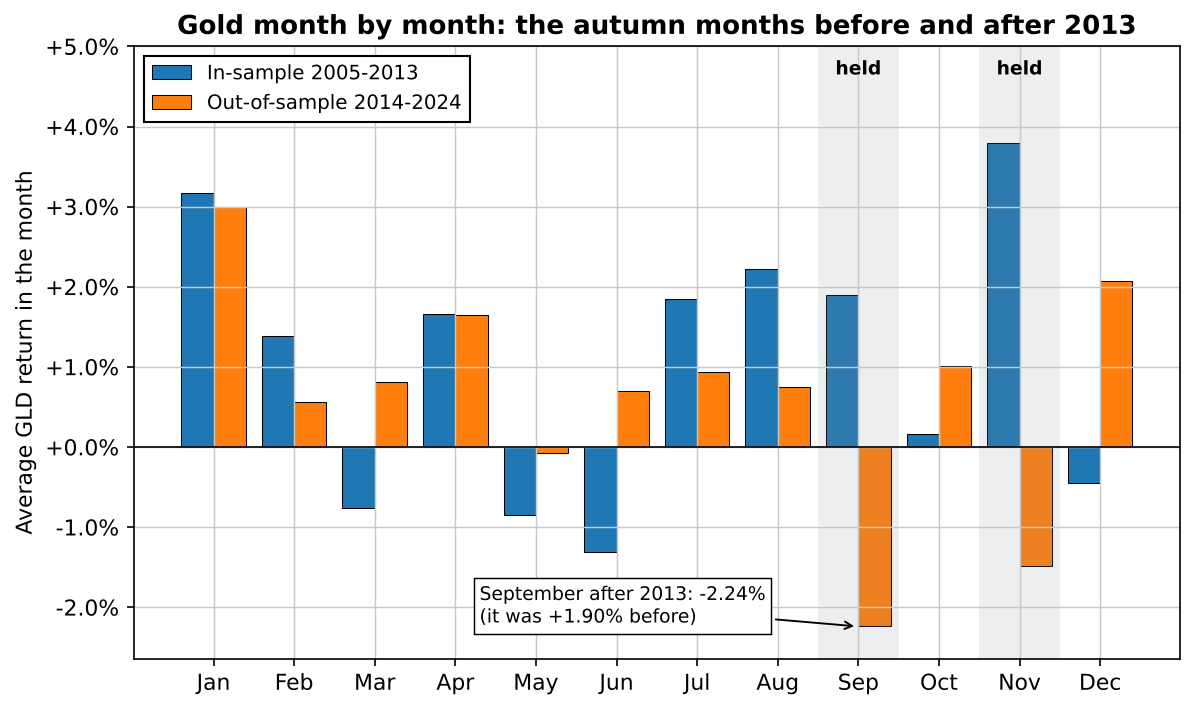
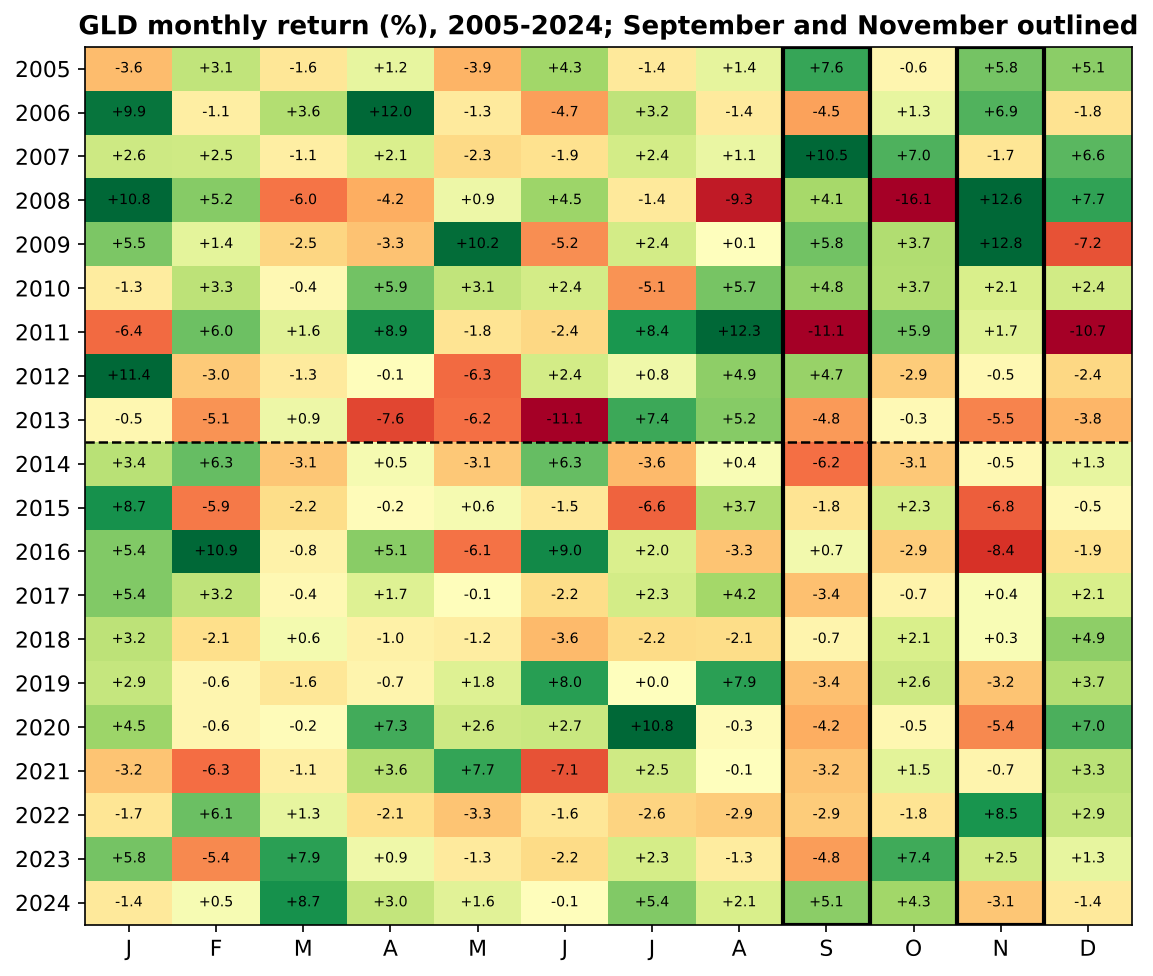
Look at the September column first. 2 of 11 trades won, averaging -2.34% after costs; before 2014 the September trade won 6 of 9 and averaged +1.80%. November held up a little better, 4 winners of 11 and an average of -1.58%, against 6 of 9 and +3.70% before. The heatmap shows the same thing without any trading rule at all.
The worst autumn of the out-of-sample years was 2020, and it is a good example of what a calendar rule can't know.
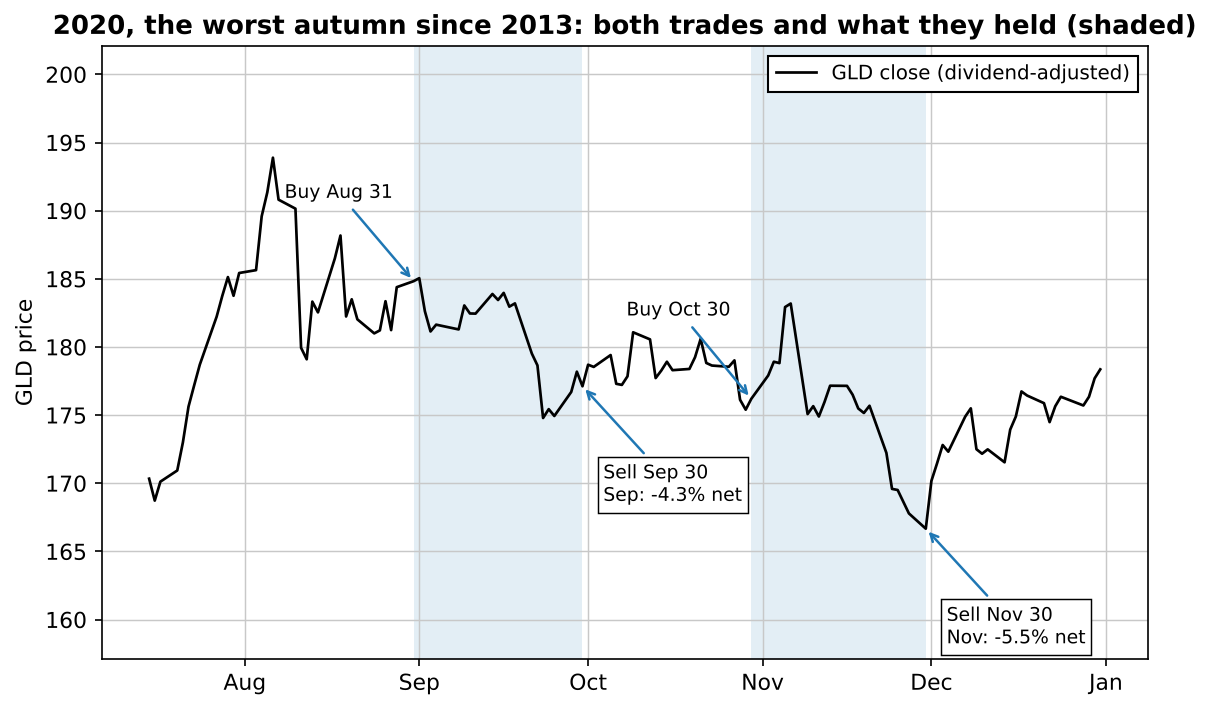
Nothing went wrong with the execution in 2020. The rule did exactly what it says. Gold just fell in those two months that year, as it did in most years after the paper. Which raises the obvious objection: maybe the end of the month is the wrong day to trade.
Moving the dates does not rescue it
The registration fixed a grid in advance: move the entry and the exit by 5 trading days earlier, not at all, or 5 days later, 9 combinations, reported rather than picked. In-sample the Sharpe ranged from 0.11 to 0.72. Out of sample, every one of the 9 was negative, from -0.76 to -0.34. None comes near the 0.6 line, so this isn't about getting the dates slightly wrong. Costs aren't the problem either: before any costs at all the out-of-sample Sharpe was -0.65, and at 4x costs -0.79. That left one more place to look.
Two filters looked better on old data, and both failed
The registration had no improvement of its own. Every strategy article still runs the site's standard list of possible improvements, current version 2026-11-08, fixed before this run. The choice uses in-sample data only: every bar after 2013 is deleted before any variant or indicator is computed. An item is kept if it raises the in-sample Sharpe by at least 0.10 and beats the base rule in at least 70% of its settings; at most two are kept and then run out of sample once. Four items apply to a long-only seasonal rule on one market, tried in 12 settings. The base rule's in-sample Sharpe was 0.55:
| Menu item (in-sample only, 2005-2013) | Change in Sharpe | Share of settings better | Kept? | Out-of-sample Sharpe |
|---|---|---|---|---|
| Trend filter (previous close above its 150/200/250-day average, exit when it flips) | -0.09 | 0% | no | not run |
| Calm market only (no entry when 20-day volatility is above its 70th/80th/90th percentile) | +0.16 | 100% | kept | -0.76 |
| Volatility-scaled size (10/20/40-day volatility, at most 2x) | +0.19 | 100% | kept | -0.79 |
| Fixed holding time (5/10/15 days) instead of month end | -0.27 | 33% | no | not run |
| Fear filter, ATR stop, Fed days, one side, VWAP distance, several markets | do not apply (the list limits them to other styles or directions, and this test has one market) | |||
Both kept items failed the same 0.6 line out of sample: the calm-market filter scored -0.76 on 18 trades and volatility sizing -0.79. That is the point of choosing on old data only. Both looked like clear improvements in 2005-2013, at every setting, and neither changed the fact that gold mostly fell in September and November afterwards. A filter can't fix a signal that has gone.
Lab notes
The test was registered on 2026-11-15 and ran unattended early on November 17. My first month-by-month chart counted December 2004 as an in-sample December, because GLD started trading in November 2004 and its first full month was December. One month shouldn't decide anything, but it put a different number in the December bar, so I cut the monthly comparison to whole calendar years, 2005 onwards; the trades themselves never used 2004. The other thing I noticed: the volatility-sizing item scored the same in-sample Sharpe, 0.74, at all three lookbacks. That looked like a bug, so I printed more decimals: 0.7415, 0.7403 and 0.7383. Not a bug, just an item that barely depends on its setting. It was kept, and it failed anyway.
So what is the best month to buy gold? On this evidence there isn't one you can rely on. The months that looked best before 2013 were the two worst after it, and a seasonal edge built on two trades a year needs decades to tell apart from luck. If you own gold, own it for its own reasons. The calendar is not one of them anymore.
Get the autumn-effect rules + the Python code (PDF)
Every rule from this test on one page, the results table, and standalone Python you can run on your own data. Free, by email.
Instant delivery. One PDF, no spam. Unsubscribe anytime.
FAQ
What is gold's autumn effect?
It is the finding in Baur, D. G. (2013), The autumn effect of gold, Research in International Business and Finance 27(1), 1-11, that gold's returns in September and November stood out from the other months. The trading rule tested here holds GLD from the last close of August to the last close of September, and from the last close of October to the last close of November, and is flat the rest of the year.
What is the best month to buy gold?
There is no month you can rely on. From 2005 to 2013 November was GLD's best calendar month (+3.80% on average) and September was strong too. From 2014 to 2024 September was the worst of the twelve (-2.24%) and November the second worst (-1.48%), while January was the best (+3.00%). We did not test January as a rule; the point is that the ranking of months changed completely after the paper.
Does gold's September seasonality still work?
Not since 2013 in our test. The September trade (last close of August to last close of September, 0.05% per side) won 2 of 11 times from 2014 to 2024 and averaged -2.34%. Before that it won 6 of 9 times and averaged +1.80%. Moving the entry and exit by 5 trading days either way did not change the picture: every one of the 9 combinations had a negative out-of-sample Sharpe.
Is two trades a year enough to test a seasonal strategy?
Not to prove much. The whole test has 18 in-sample and 22 out-of-sample trades, and the in-sample years overlap the period the paper studied. The in-sample t-statistic was 1.79, below the usual bar of about 2. What the out-of-sample years do show is a consistent reversal: the two months lost money together in 9 of 11 years, and the t-statistic of the 22 trades was -2.37.
Is there a gold seasonality strategy PDF?
Yes. EdgeLab's free PDF has every rule as tested, the results table and standalone Python code you can run on your own daily data. It is sent by email from the signup box in the article.

Robin Eriksson
Founder of EdgeLab. Five years of discretionary losses taught me to test everything — now I publish the strategies that survive. About me →
Related: The Turtle Soup strategy, tested: Raschke's rules and the ICT version both fail on 16 years of futures · Linda Raschke's Holy Grail trading strategy, tested: as written, it almost never trades · The Williams %R strategy on the Nasdaq: 27 years, net of costs