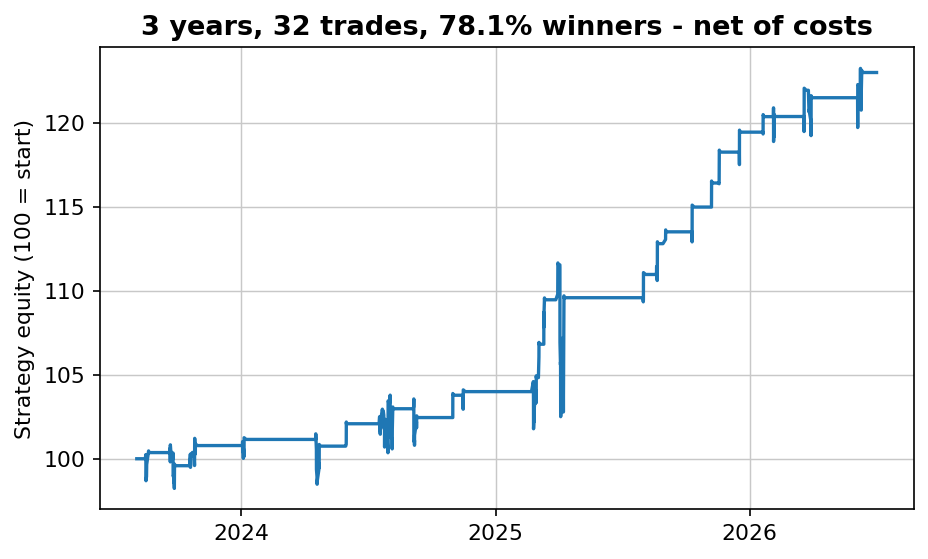
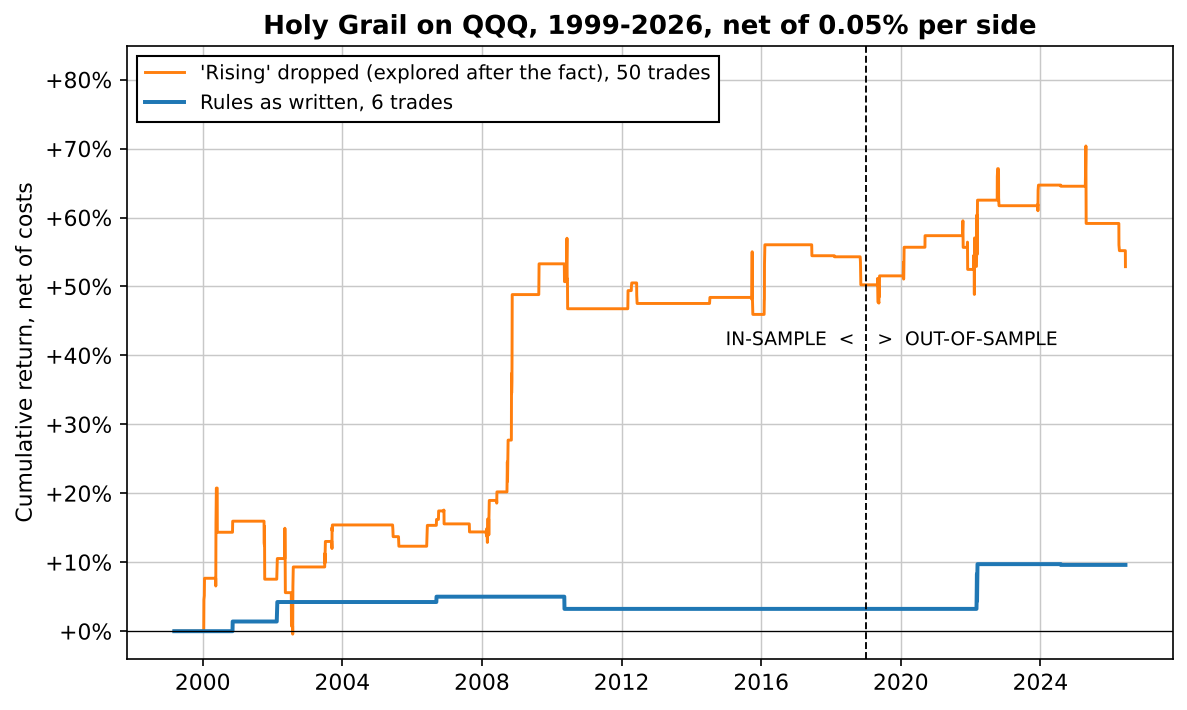
The short version: the Holy Grail as it is usually written down (ADX above 30 and rising, then a pullback to the 20-day EMA) found just 19 setups in 113.8 market-years of daily data across five markets, and only 11 of them turned into trades. On QQQ, the main market, it technically clears my pre-registered pass line out of sample, on 2 trades, one of which lost only its costs. That is not evidence of anything. Drop the word "rising" (explored after the fact, clearly labelled below) and it trades 50 times on QQQ: Sharpe 0.44 in-sample, 0.07 out-of-sample, profit factor 1.18. That does not hold up, and neither do three of the other four markets. The pre-registered trailing stop doesn't rescue it. And one honest catch: the single market that passes is one I wouldn't trust.
The setup is simple, and I fixed the rules before running it
I've read Raschke and Connors, and those books helped me a lot. That is exactly why this one gets the same treatment as everything else on this site. The Holy Grail is a pullback trade inside a strong trend. ADX measures how strong a trend is, whichever way it points; +DI and -DI say which way. When ADX is above 30 and climbing, the book says, wait for the first pullback to the 20-period exponential moving average and buy when price takes out the high of the bar that touched it. The target is the recent swing high. Shorts are the mirror image.
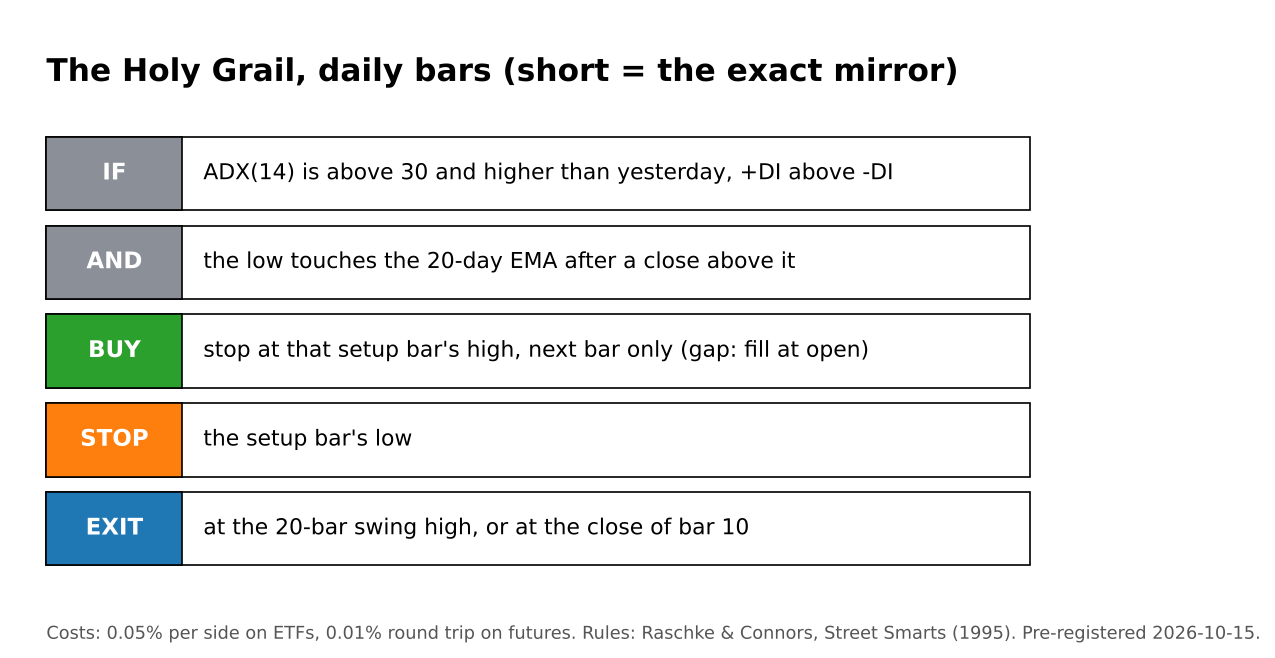
Every detail a book leaves open has to be pinned down before a computer can test it, so I wrote them down first. The setup bar's low must touch the EMA after a close above it. The buy stop is good for one bar only. If the market opens above the trigger, the fill is the open, not the trigger price. That is our standard fill rule, and it has killed a breakout test of ours before. The target is the highest high of the 20 bars before the setup, and a trade that hasn't hit stop or target is closed at the close of bar 10. If one bar contains both stop and target, the stop counts. Costs are 0.05% per side on the ETFs and 0.01% round trip on the futures, the level we used in the opening range breakout and Zarattini articles.
The markets: QQQ from 1999, SPY from 1993, GLD from 2004, and Nasdaq-100 (NQ) and gold (GC) futures from 2010. Everything up to the end of 2018 is in-sample; 2019 onwards is out-of-sample. I also registered a pass line before running anything: an out-of-sample profit factor below 1.1 or a Sharpe below 0.3 on QQQ means "does not hold up". The first surprise came before any of that mattered.
As written, it almost never fires
Across five markets and 113.8 years of daily bars, the rules produced 19 setups. That is 0.17 per market per year, or about one every six years. GLD, in 21.6 years, produced none at all. Eleven of the setups were triggered by the next bar and became trades. Here they are, every one of them:
| Row | Market | Side | Entry | Exit (detail) | Bars held | Net |
|---|---|---|---|---|---|---|
| 1 | SPY | long | Mar 13, 1995 | target (target already passed) | 1 | -0.10% |
| 2 | QQQ | short | Nov 9, 2000 | target (gap fill) | 1 | +1.41% |
| 3 | QQQ | short | Feb 15, 2002 | target | 2 | +2.76% |
| 4 | SPY | short | Apr 27, 2005 | stop (gap fill) | 5 | -1.76% |
| 5 | QQQ | long | Sep 12, 2006 | target | 1 | +0.74% |
| 6 | QQQ | short | May 13, 2010 | stop | 1 | -1.69% |
| 7 | SPY | short | May 14, 2010 | target (gap fill) | 8 | +8.69% |
| 8 | QQQ | short | Mar 4, 2022 | target (gap fill) | 7 | +6.25% |
| 9 | GC | short | Jul 6, 2023 | stop | 4 | -1.09% |
| 10 | QQQ | short | Aug 2, 2024 | target (gap fill, target already passed) | 1 | -0.10% |
| 11 | NQ | short | Aug 2, 2024 | target (gap fill, target already passed) | 1 | -0.01% |
Study row 8 first: it is the whole out-of-sample result on QQQ, and the next chart takes it apart. Then look at rows 10 and 11. On August 2, 2024 the market gapped down so hard that the open was already below the profit target. The short was filled at the open and the target was behind it, so the trade closed at once and paid its costs for nothing. Three of the 11 trades ended that way, and 6 of the 11 were filled at the open rather than at the trigger price.
Why so rare? Because the two conditions fight each other. A pullback to the moving average is exactly the kind of bar that makes ADX stop rising. Of all the days when a strong trend (ADX above 30) touched its 20-day EMA, only 3.0% came with ADX still higher than the day before. The "first pullback in a rising ADX" is a lovely idea on a chart, where you can see the trend, but as a mechanical rule it mostly describes days that don't happen. Before I loosen anything, here is what the rules as written did on QQQ.
The one trade behind the out-of-sample "pass"
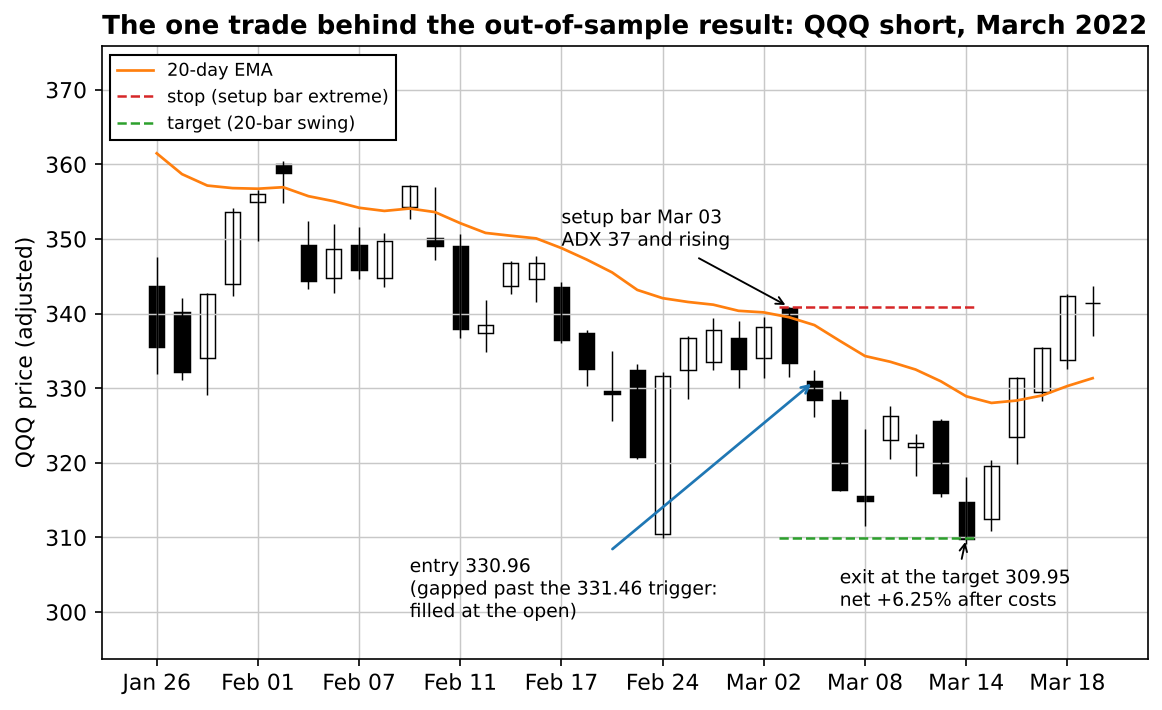
This is a good trade, and it is what the Holy Grail is supposed to look like. It is also nearly all of the out-of-sample record. The other QQQ trade after 2018 was row 10, the cost-only loss of -0.10%, and that tiny loss is why the profit factor comes out at 62.50. By the letter of the pre-registration, QQQ clears the pass line (profit factor above 1.1, Sharpe 0.38). By any sensible reading, two trades in seven and a half years can't tell an edge from a coin. The table puts it next to the looser version I explored afterwards:
| QQQ, net of 0.05%/side | As written, in-sample | As written, out-of-sample | "Rising" dropped, in-sample | "Rising" dropped, out-of-sample |
|---|---|---|---|---|
| Trades | 4 | 2 | 35 | 15 |
| Win rate | 75.0% | 50.0% | 57.1% | 46.7% |
| Average trade | +0.81% | +3.08% | +1.20% | +0.18% |
| Median trade | +1.07% | +3.08% | +0.74% | -0.10% |
| Profit factor | 2.91 | 62.50 | 2.10 | 1.18 |
| Total return | +3.2% | +6.2% | +50.2% | +1.8% |
| CAGR | 0.16% | 0.81% | 2.08% | 0.23% |
| Max drawdown | -1.7% | -3.6% | -17.5% | -10.3% |
| Time in market | 0.1% | 0.4% | 2.4% | 3.2% |
| Sharpe (daily, annualised) | 0.22 | 0.38 | 0.44 | 0.07 |
To get a sample big enough to judge, something has to give. The obvious candidate is the one word that kills almost every setup.
Loosened to trade more, the edge fades after 2018
This part was explored after the fact, not pre-registered. I kept every rule and dropped only "ADX higher than yesterday": ADX above 30 on the setup bar is enough. Nothing else was changed or tuned. The setup count goes from 19 to 636, 33.5 times as many, and QQQ trades about 1.8 times a year.
In-sample, it looks like a strategy: 35 trades, 57.1% winners, an average trade of +1.20% after costs, profit factor 2.10, Sharpe 0.44. Out of sample, 15 trades: 46.7% winners, the median trade a loss (-0.10%), profit factor 1.18 and a Sharpe of 0.07. That is below the pass line, and it isn't close. The year-by-year record shows why the in-sample number flattered it:
| Year | QQQ, "rising" dropped | Year | QQQ, "rising" dropped |
|---|---|---|---|
| 1999 | 0.0% (no trade) | 2013 | 0.0% (no trade) |
| 2000 | +16.0% | 2014 | +0.6% |
| 2001 | -7.3% | 2015 | -1.7% |
| 2002 | +1.6% | 2016 | +6.9% |
| 2003 | +5.6% | 2017 | -1.0% |
| 2004 | 0.0% (no trade) | 2018 | -2.7% |
| 2005 | -2.7% | 2019 | +0.9% |
| 2006 | +2.9% | 2020 | +3.8% |
| 2007 | -1.0% | 2021 | -3.1% |
| 2008 | +30.1% | 2022 | +6.1% |
| 2009 | +3.0% | 2023 | +1.8% |
| 2010 | -4.3% | 2024 | -0.1% |
| 2011 | 0.0% (no trade) | 2025 | -3.3% |
| 2012 | +0.5% | 2026 (to June) | -3.9% |
13 positive years, 11 negative, and one year, 2008, doing most of the work. Shorting rallies into the moving average during a crash pays well. The rest of the time it's a coin flip with a 17.5% drawdown attached. QQQ is only one market, though, and the next question is whether the others agree.
Four of five markets fall below the line, and the fifth is a mirage
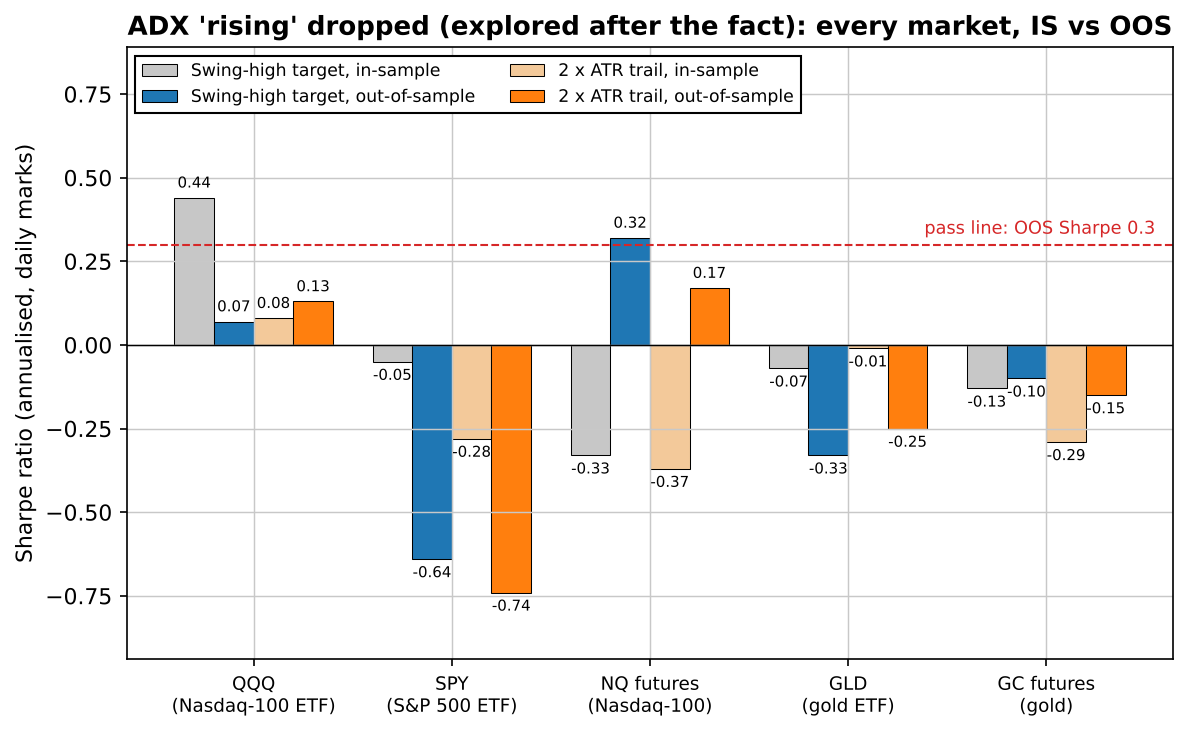
| Market | Data | Setups as written | Trades as written | Trades, "rising" dropped | IS Sharpe | OOS Sharpe | OOS profit factor | Pass line |
|---|---|---|---|---|---|---|---|---|
| QQQ | 1999–2026 | 7 | 6 | 50 | 0.44 | 0.07 | 1.18 | below |
| SPY | 1993–2026 | 7 | 3 | 44 | -0.05 | -0.64 | 0.03 | below |
| NQ futures | 2010–2026 | 1 | 1 | 26 | -0.33 | 0.32 | 1.77 | above |
| GLD | 2004–2026 | 0 | 0 | 34 | -0.07 | -0.33 | 0.43 | below |
| GC futures | 2010–2026 | 4 | 1 | 38 | -0.13 | -0.10 | 0.84 | below |
SPY is the bluntest result: out of sample, 10 trades and only 20.0% winners, a profit factor of 0.03. On gold the trend-pullback idea never worked in either period. Most GLD trades (70.6%) ended at the stop. NQ futures are the one that passes, with an out-of-sample Sharpe of 0.32 and profit factor 1.77, but on 18 trades and after an in-sample Sharpe of -0.33. A rule that lost money for eight years and then made some is the same pattern that made us distrust the short side of the Zarattini strategy: a period, not an edge. It also disagrees with QQQ, which tracks the same index over the same years: 0.07 on the ETF, 0.32 on the futures. The futures use regular-session bars with different gaps, so the two produce different trade lists, and a setup whose verdict flips with the data build is telling you its results are mostly noise. Before blaming the markets, I tried the one fix I had registered in advance.
The pre-registered trailing stop doesn't rescue it
The obvious objection to any pullback test is the exit. Maybe the swing-high target cuts the winners short. So the brief allowed exactly one change, decided before the run: swap the fixed target for a trailing stop 2 x ATR(14) behind the best price since entry. The one change meant everything else stayed, including the exit at the close of bar 10, so winners are still capped at ten bars: 26.0% of the loosened QQQ trades ended on that time exit. Within that window, it didn't help. On the rules as written, QQQ's two out-of-sample trades made a Sharpe of 0.05. On the loosened version, QQQ's out-of-sample Sharpe went from 0.07 to 0.13 while its in-sample Sharpe dropped from 0.44 to 0.08, and all 5 markets ended below the pass line, NQ included (0.17).
Costs aren't the problem either. On the futures, the 0.01% round trip barely registers:
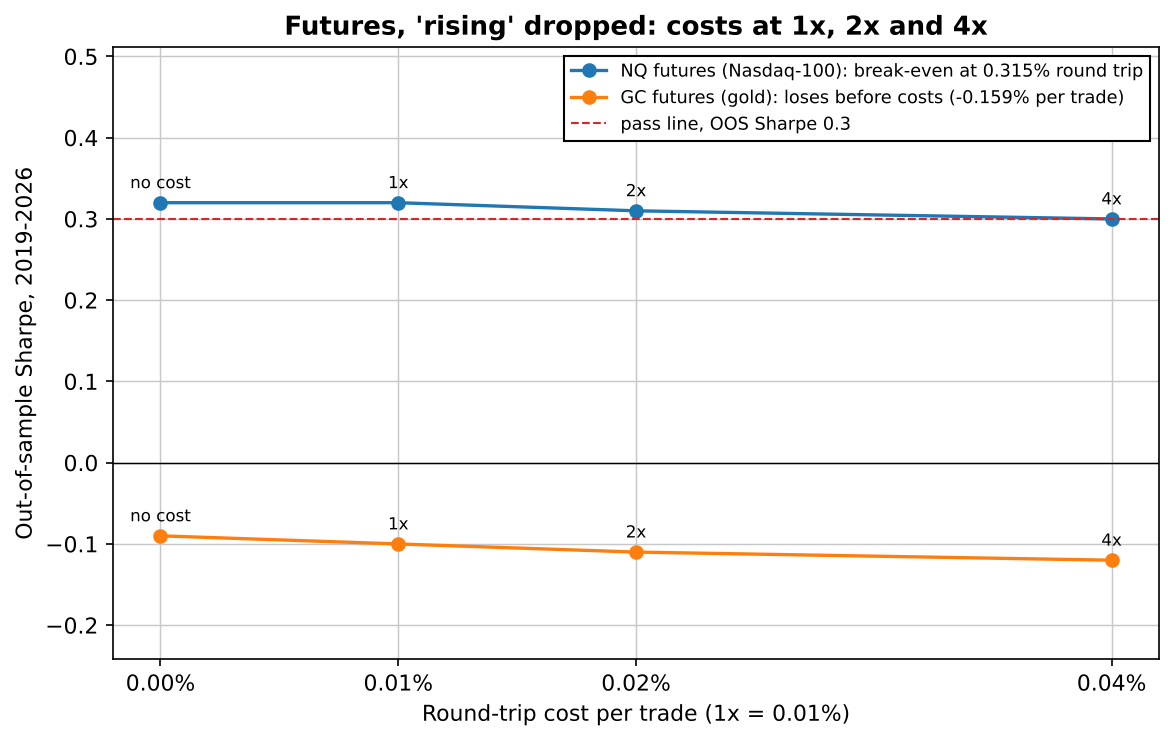
When a strategy fails like this with costs barely mattering, the problem is the signal, not the friction. The last check is whether the book's parameters were just unlucky.
No neighbouring setting rescues it either
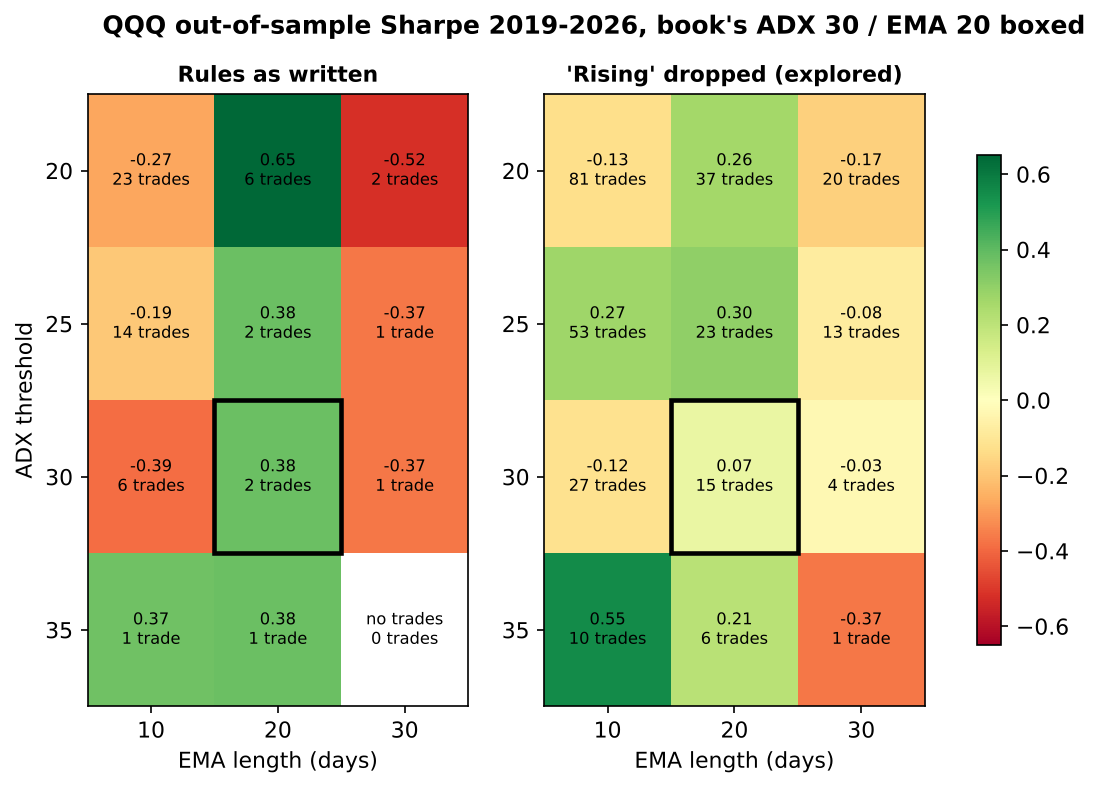
I registered this map as something to report, not to choose from, and it is a good thing I did. A real edge shows up as a plateau, where neighbouring settings all work a bit. Here the loosened version reaches the line in two cells that don't touch: ADX 35 with a 10-day EMA, and ADX 25 with the book's 20-day EMA, which lands exactly on 0.30. The best cell, 0.55, rests on 10 trades. There is a near-plateau at ADX 20 to 25 with a 10- or 20-day EMA (0.26, 0.27 and 0.30), but it sits at the line rather than above it, and I only know it is there because I looked at out-of-sample data, which makes it a reason for a new test, not a setting to trade. On the left, the rules as written have so few trades that a single exit flips a cell from red to green. Neither map gives a reason to believe a different setting would have saved it.
It agrees with our strategy graveyard
This isn't the first time a Street Smarts setup has gone through our tests. The strategy graveyard lists classic book patterns from Raschke & Connors, DeMark, Kaufman and Chande: 17 tested, none cleared the stricter bar we use for adding a strategy to a portfolio. That bar includes a correlation filter, and the graveyard says plainly that some of those patterns failed because they were too correlated with strategies already in the tested portfolio, not because they were dead.
This test asks an easier question (does it work on its own, net of costs, out of sample?) and the Holy Grail still fails it. So it doesn't belong among the patterns rejected only for correlation. On these five markets, it is one of the ones that just don't hold up. What would change my mind is a version with a mechanical definition of "first pullback" that trades often enough to judge and holds up after 2018, tested the same way.
Lab notes
This test was registered on 2026-10-15: rules, markets, split, costs, the one allowed improvement and the pass line, committed before a single trade was simulated. The run itself started at 03:36 UTC on October 20. The first version of the script crashed halfway through, and the crash was the finding: my code assumed every market would produce at least one trade, and GLD produced none in 21.6 years. Then the QQQ line printed 6 trades in 27 years, and my first check was whether my ADX was broken. It wasn't. Counting the conditions one by one showed that only 3.0% of strong-trend touches of the EMA came with ADX still rising. The second surprise was the trade log. Three of the 11 trades closed the moment they opened, because the fill was already beyond the target, and each one cost money. On August 2, 2024 that was a gap: a backtest that filled the QQQ order at the trigger price would have booked a small winner instead.
So, is there a Holy Grail? Not in this setup, not on these markets, not as a rule a computer can follow. The idea underneath it (trade with a strong trend, enter on a pullback, keep the stop tight) isn't refuted by one test. This mechanical version of it just doesn't add an edge you can measure.
Get the Holy Grail rules + the Python code (PDF)
Every rule from this test on one page, the results table, and standalone Python you can run on your own data. Free, by email.
Instant delivery. One PDF, no spam. Unsubscribe anytime.
FAQ
What is the Holy Grail trading strategy?
It is a trend pullback setup from Linda Bradford Raschke and Laurence Connors' book Street Smarts (1995). When ADX(14) is above 30 and rising, showing a strong trend, you wait for price to pull back to the 20-period exponential moving average and buy a break of the high of the bar that touched it (short sales are the mirror image). The stop goes at that bar's low and the profit target at the recent swing high.
Does Linda Raschke's Holy Grail strategy work?
Not in our test. With the rules as usually written, it found 19 setups in 113.8 market-years of daily data across QQQ, SPY, GLD and Nasdaq and gold futures, too few to judge. With the ADX-rising condition dropped (explored after the fact), it traded 50 times on QQQ: Sharpe 0.44 in-sample but 0.07 out-of-sample, profit factor 1.18, below our pre-registered pass line. Four of five markets failed, and a 2 x ATR trailing stop did not rescue it.
Why does the Holy Grail setup trigger so rarely?
Because the pullback it waits for is the same thing that stops ADX rising. In our data, only 3.0% of strong-trend touches of the 20-day EMA happened on a day when ADX was still higher than the day before. Require both at once and the setup almost disappears: GLD produced none in 21.6 years.
Is there a Holy Grail trading strategy PDF?
Yes. EdgeLab's free PDF has every rule from this test on one page, the results table, and standalone Python code you can run on your own daily data, including a switch for the looser variant. It is sent by email from the signup box in the article.

Robin Eriksson
Founder of EdgeLab. Five years of discretionary losses taught me to test everything — now I publish the strategies that survive. About me →
Related: Almost all of the Nasdaq's return happens while you sleep. Can you trade it? · Does Connors' RSI(2) still work? We tested it on the Nasdaq · Is the opening range breakout dead? We tested it on the Nasdaq