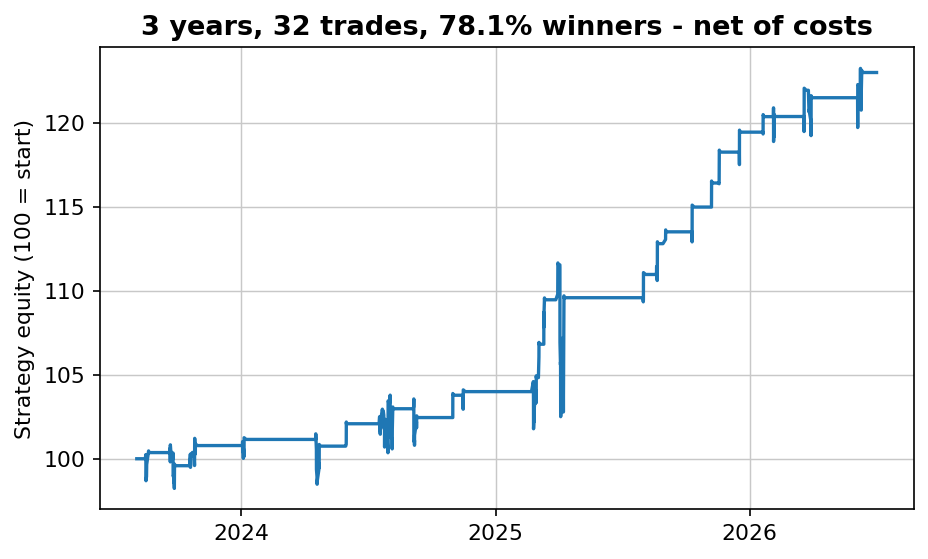
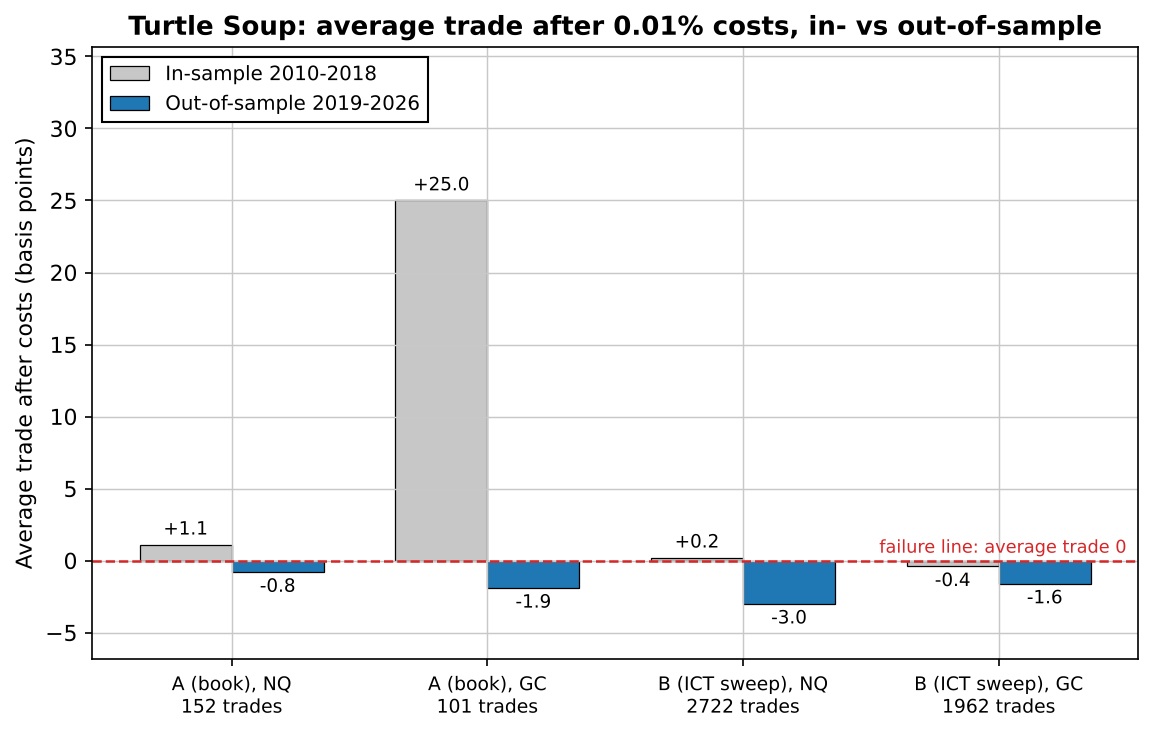
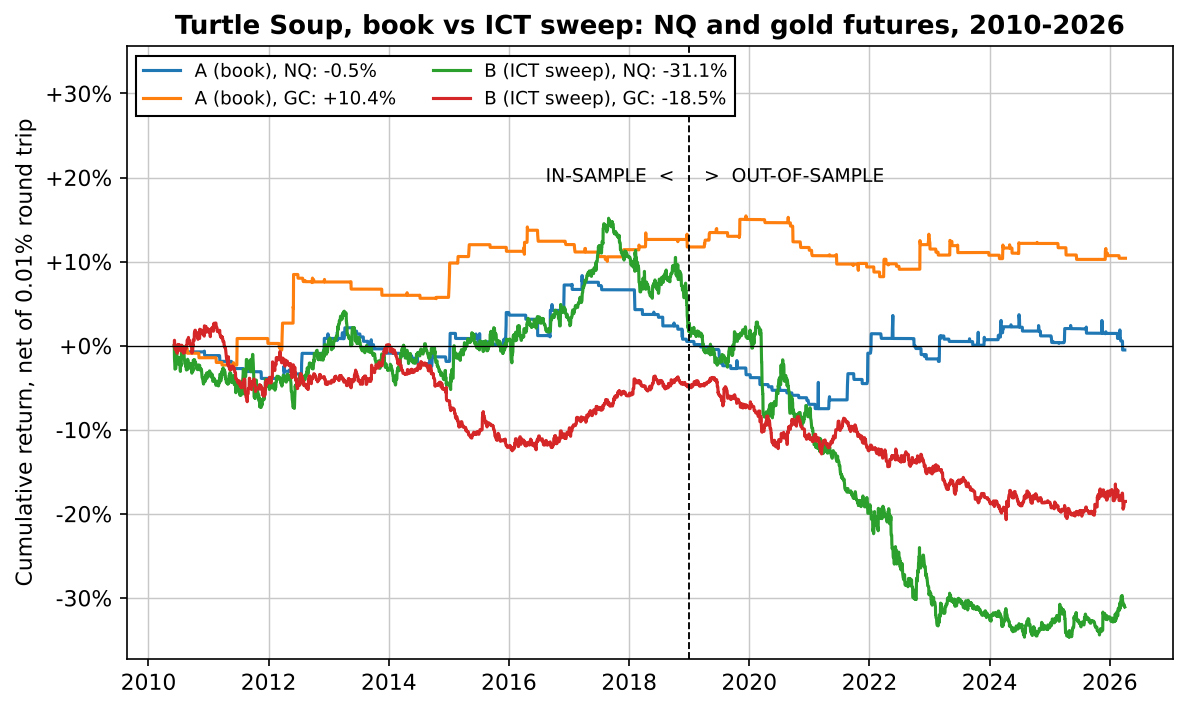
The short version: no. Across 4,937 trades on Nasdaq-100 (NQ) and gold (GC) futures from 2010 to 2026, all 4 of 4 combinations of version and market had a negative average trade out of sample (2019 onwards), after a 0.01% round-trip cost. That was the pre-registered failure line. Raschke's book version is almost exactly break-even, which after costs means a small loss: -0.8 bp per trade on NQ, -1.9 bp on gold. The ICT sweep version trades on most NQ sessions and bleeds: -31.1% on NQ over the full period. Four fixes from our improvement menu, chosen on in-sample data only, failed too. And one honest catch: on gold, the book version looked excellent until 2018, with a Sharpe of 0.55. Stop the test there and you would publish the wrong answer.
Two readings of one idea: bet that the breakout fails
I've read Raschke and Connors, and their books helped me a lot. That is why this one gets the same treatment as everything else here. The Turtle traders bought a new 20-day high and sold a new 20-day low. Turtle Soup, from Street Smarts (1995), takes the other side of exactly that trade: same level, opposite direction. If a market breaks its 20-day low and the break fails, the traders who sold it are trapped, and Raschke buys. The ICT community tells the same story in different words. Obvious highs and lows hold resting stop orders ("liquidity"), price runs them, then reverses. ICT calls that a turtle soup too.
So I tested both, with every rule written down on 2026-10-15, before a single trade was simulated:
- Version A, the book (long shown, short is the mirror). The prior 20-session low must have been set at least four sessions ago. Today trades below it. After that, a buy stop 0.25% above the old low, valid for this session only. Stop one tick under the session low at the moment of entry. Once the trade is up by its initial risk (+1R), the stop moves to break-even. Exit at the close of the second session after entry.
- Version B, the ICT reading. During the session, price trades beyond the prior day's high or low. Then a 5-minute bar closes back inside the prior day's range: enter at that close, against the sweep. Stop one tick beyond the sweep's extreme, target 2R, and flat at 15:55 New York time. One trade a day, the first signal.
The data is the part most tests skip. A daily bar can't tell you whether the high came before or after the break of the low, and Turtle Soup is entirely about that order. So every entry here is simulated on intraday bars: one-minute bars for NQ, 15-minute bars for gold (the finest gold data I have, so version B on gold uses 15-minute signal bars and goes flat at 15:45). The session is 09:30-16:00 New York time for both markets, and the daily highs and lows come from it. A buy stop that a bar opens above is filled at the open, never at the trigger. That is our standard fill rule. If the stop and the target are inside the same bar, the stop counts. Version A holds overnight, so the continuous futures were first adjusted for the 53 contract rolls in NQ and 67 in gold that would otherwise show up as fake overnight moves.
Costs are 0.01% of price per round trip, the same as in our opening range breakout and Zarattini tests, with 2x and 4x further down. In-sample is June 2010 to December 2018, out-of-sample is 2019 to April 2026. The failure line: an out-of-sample average trade at or below zero after costs. Here is how the four runs look over time.
The book version breaks even, and after costs that is a loss
Version A is a rare trade. It fired 152 times on NQ and 101 times on gold in 15.8 years, about 10 and 6 times a year, and it is in the market only 2.7% and 2.2% of the time. The numbers side by side:
| Net of 0.01% round trip | A (book), NQ, in-sample | A (book), NQ, out-of-sample | A (book), GC, in-sample | A (book), GC, out-of-sample |
|---|---|---|---|---|
| Trades | 74 | 78 | 46 | 55 |
| Win rate | 13.5% | 14.1% | 28.3% | 20.0% |
| Average trade | +1.1 bp | -0.8 bp | +25.0 bp | -1.9 bp |
| Median trade | -0.141% | -0.010% | -0.010% | -0.010% |
| Profit factor | 1.04 | 0.97 | 2.05 | 0.93 |
| Total return | +0.5% | -1.0% | +11.7% | -1.2% |
| CAGR | +0.06% | -0.14% | +1.30% | -0.17% |
| Max drawdown | -7.2% | -8.0% | -3.6% | -6.3% |
| Time in market | 2.4% | 2.9% | 2.2% | 2.2% |
| Sharpe (daily, annualised) | 0.04 | -0.03 | 0.55 | -0.07 |
Study the win rate first, because it looks broken and isn't. On NQ only 14.1% of trades won out of sample. That is the break-even stop at work. 37.5% of NQ trades and 27.7% of gold trades went up by one R, came back and were closed at the entry price, which after costs is a loss of exactly 0.01%. That is also why the median trade is -0.01%. The few winners are large: out of sample the average NQ winner made 164.1 bp and the average loser lost 27.9 bp. To break even with those payoffs it needs 14.5% winners. It got 14.1%. Close, and on the wrong side.
Gold is the trap. In-sample, 46 trades, a profit factor of 2.05, an average trade of +25.0 bp and a Sharpe of 0.55. That is the kind of table that ends up in a course. Out of sample, on 55 trades: -1.9 bp, profit factor 0.93, Sharpe -0.07. Nothing about the rules changed in 2019. The in-sample gain was a handful of big winners, and they didn't come back. The ICT version trades far more often, which should make its answer clearer.
The ICT sweep trades all the time and bleeds slowly
A sweep of the prior day's high or low followed by a close back inside is common. Version B found a signal on 67.2% of NQ sessions and 48.2% of gold sessions: 2,722 and 1,962 trades. With that many trades there is no room for luck to hide behind.
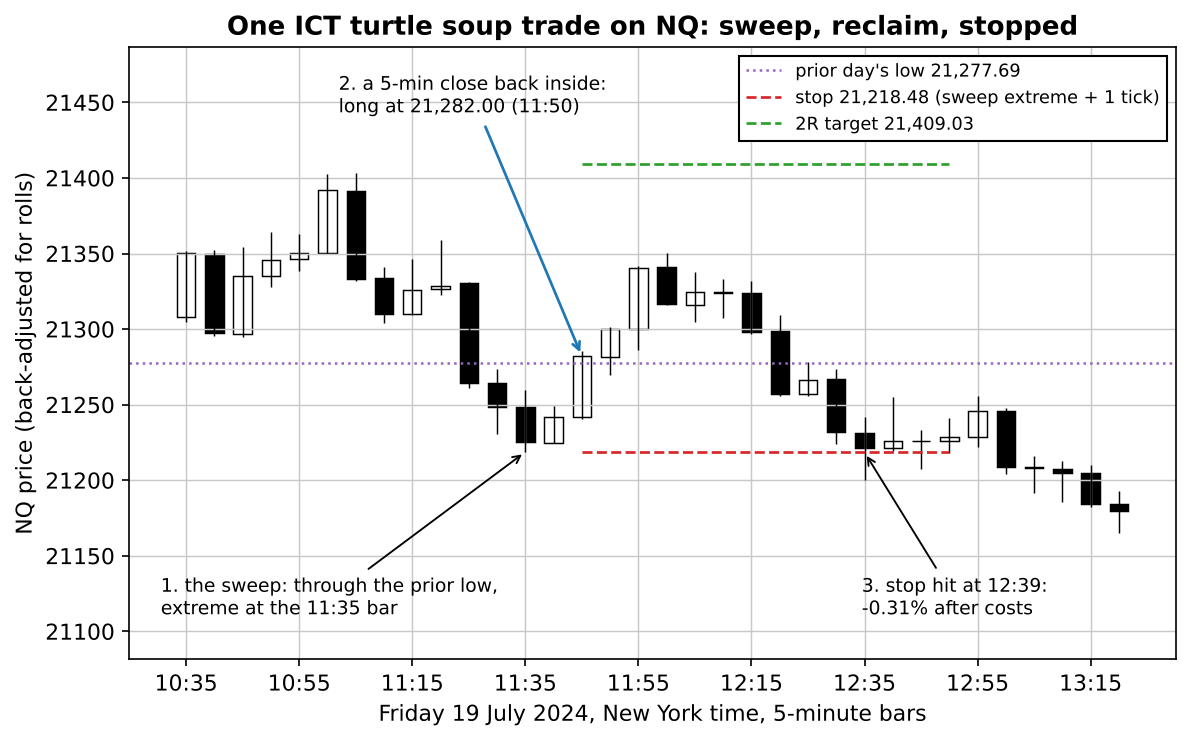
On a chart the sweep-and-reclaim looks like a tell. Across the whole sample it is a coin that lands slightly wrong:
| Net of 0.01% round trip | B (ICT), NQ, in-sample | B (ICT), NQ, out-of-sample | B (ICT), GC, in-sample | B (ICT), GC, out-of-sample |
|---|---|---|---|---|
| Trades | 1,482 | 1,240 | 1,048 | 914 |
| Win rate | 38.7% | 37.0% | 40.4% | 38.5% |
| Average trade | +0.2 bp | -3.0 bp | -0.4 bp | -1.6 bp |
| Median trade | -0.079% | -0.095% | -0.070% | -0.090% |
| Profit factor | 1.01 | 0.85 | 0.97 | 0.88 |
| Total return | +1.7% | -32.2% | -4.8% | -14.4% |
| CAGR | +0.20% | -5.23% | -0.58% | -2.12% |
| Max drawdown | -11.7% | -36.5% | -14.8% | -17.6% |
| Time in market | 5.0% | 5.2% | 4.9% | 5.1% |
| Sharpe (daily, annualised) | 0.06 | -0.74 | -0.15 | -0.52 |
The win rate holds up fine, 37.0% on NQ and 38.5% on gold out of sample. The problem is the payoff. Only 23.6% of NQ trades reached the 2R target; 51.1% hit the stop and the rest were closed at 15:55, usually for a small move either way. The average NQ winner made 45.7 bp and the average loser lost 31.6 bp, so it needed 40.9% winners to break even. Measured in R, the average NQ trade earned +0.015R over the whole period and -0.007R out of sample, before costs. That is zero with a rounding error. The next chart puts every version's win rate next to the one it needed.
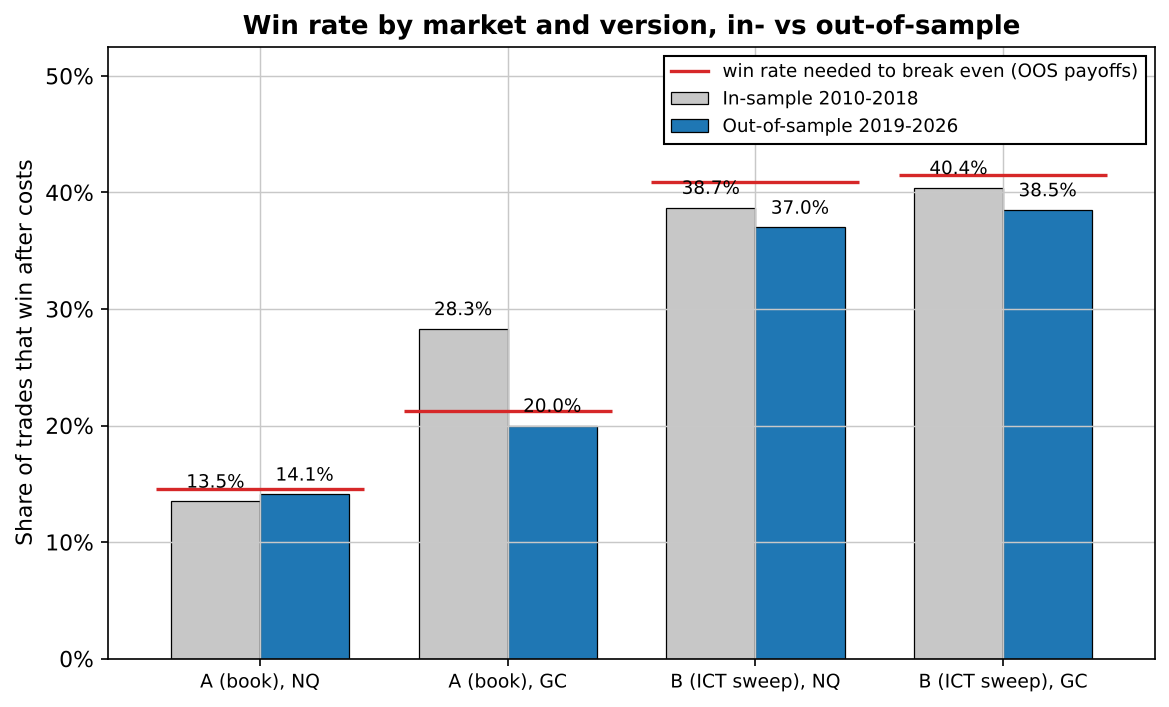
A miss of a few points sounds small. Over 172 trades a year it is -32.2% on NQ out of sample, with a drawdown of -36.5%. The obvious defence is that 0.01% per trade is what grinds it down. It isn't.
Costs are not what kills it
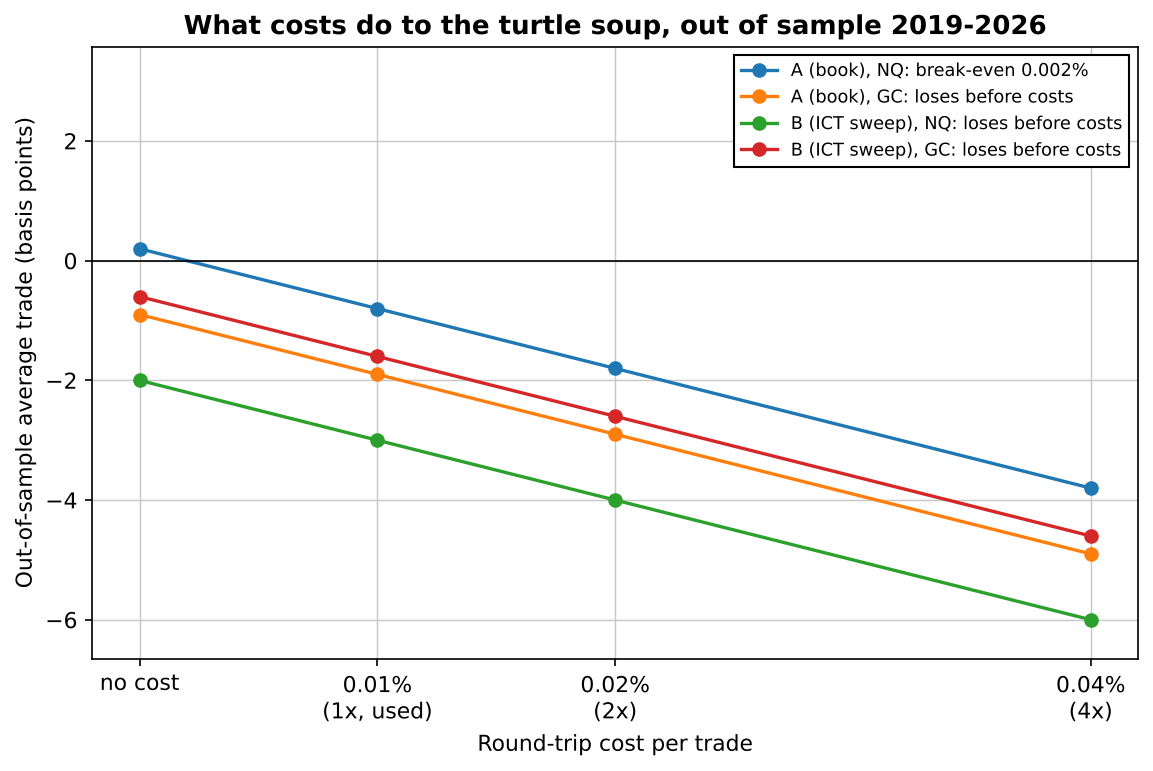
Before costs, out of sample: the ICT sweep made -2.0 bp per trade on NQ and -0.6 bp on gold, and the book version made -0.9 bp on gold. A trader with free commissions and perfect fills would still have lost on three of the four. At 4x costs, everything is clearly negative, which is the direction costs only ever push. When a strategy fails before costs, the signal is the problem, not the friction. Is the loss one bad stretch, though?
Year by year, the losses are spread out, not one bad stretch
| Year | A (book), NQ | A (book), GC | B (ICT), NQ | B (ICT), GC |
|---|---|---|---|---|
| 2010 | -1.2% | -1.4% | -3.4% | +1.8% |
| 2011 | -2.7% | +1.7% | -1.3% | -6.0% |
| 2012 | +4.9% | +7.3% | +5.7% | -0.0% |
| 2013 | -1.7% | -1.5% | -3.5% | +4.7% |
| 2014 | -1.0% | -0.2% | -1.7% | -6.7% |
| 2015 | +5.9% | +5.2% | +5.3% | -5.8% |
| 2016 | +3.1% | +0.7% | +2.4% | +2.0% |
| 2017 | -0.5% | -0.5% | +7.3% | +4.7% |
| 2018 | -5.8% | +0.3% | -8.0% | +1.2% |
| 2019 | -3.9% | +2.9% | -0.8% | -2.6% |
| 2020 | -3.6% | -3.2% | -9.2% | -3.9% |
| 2021 | +6.5% | -1.8% | -12.2% | -1.5% |
| 2022 | -0.7% | +3.0% | -12.4% | -2.6% |
| 2023 | +2.3% | -1.7% | -3.8% | -4.5% |
| 2024 | +0.4% | +1.3% | -2.1% | -0.3% |
| 2025 | +0.3% | -1.3% | +2.0% | +0.9% |
| 2026 (to April) | -1.9% | -0.3% | +1.7% | -0.8% |
The ICT sweep on NQ lost money in 11 of 17 years, and in 6 of the 8 out-of-sample years. 2020, 2021 and 2022, three very different markets, each cost it 9.2% to 12.4%. On gold it was positive in 1 of 8 years since 2019. The book version swings around zero, a few percent a year either way, with no trend you could lean on. Before calling it, I gave both versions a fair chance to be fixed.
Four fixes looked good in-sample, and none held
Every strategy article now runs the same short list of possible improvements, registered on 2026-10-28 before any article used it: a trend filter, volatility-scaled size, a fixed holding time, an ATR stop, one side only, no trading on Fed days, and so on. The selection uses in-sample data only: the bars after December 2018 are deleted before any variant is computed. An item is kept if it raises the in-sample Sharpe by at least 0.10 on average over the two markets and beats the base rule in at least 70% of its grid of settings, at most two per version. Only then are the kept ones run out of sample, with the same costs and the same failure line. 16 items were tried in 68 settings:
| Menu item (in-sample, 2010-2018 only) | A: change in Sharpe | A: share of grid better | A: kept? | B: change in Sharpe | B: share of grid better | B: kept? |
|---|---|---|---|---|---|---|
| Trend filter (200-day average) | -0.49 | 0.00 | no | +0.01 | 0.33 | no |
| Calm market only | does not apply (the menu excludes mean-reversion strategies) | |||||
| Longs only after fear (VIX above its average), NQ | +0.10 | 1.00 | kept | -0.31 | 0.00 | no |
| Volatility-scaled size | +0.01 | 0.50 | no | +0.20 | 1.00 | kept |
| Fixed holding time instead of the exit | -0.20 | 0.00 | no | +0.17 | 0.83 | passed, not kept (ranked third) |
| ATR stop instead of the book stop | -0.17 | 0.33 | no | +0.01 | 0.50 | no |
| Keep only the better side | +0.19 | 1.00 | kept | +0.20 | 1.00 | kept |
| No position on Fed decision days | -0.05 | 0.00 | no | -0.17 | 0.00 | no |
| Both markets together, equal risk | +0.12 | 0.50 | no | -0.01 | 0.50 | no |
"Change in Sharpe" is the in-sample gain at the menu's default setting, averaged over NQ and gold; "share of grid better" is how many of the item's settings beat the base rule. Five items passed, and four were kept (the fixed holding time on version B passed but ranked third, and the limit is two). This is what the four did after 2018:
| Kept change | Market | In-sample Sharpe | Out-of-sample Sharpe | Out-of-sample trades | Out-of-sample average trade | Failure line |
|---|---|---|---|---|---|---|
| A, keep only the better side | NQ, shorts only | 0.36 | -0.55 | 44 | -14.3 bp | fails |
| A, keep only the better side | GC, longs only | 0.62 | -0.02 | 26 | -1.0 bp | fails |
| A, longs only after fear | NQ | 0.14 | -0.43 | 70 | -10.6 bp | fails |
| B, volatility-scaled size | NQ | 0.37 | -0.52 | 1,240 | -1.6 bp | fails |
| B, volatility-scaled size | GC | -0.06 | -0.56 | 914 | -1.6 bp | fails |
| B, keep only the better side | NQ, shorts only | 0.20 | -0.28 | 750 | -1.4 bp | fails |
| B, keep only the better side | GC, shorts only | 0.11 | -0.07 | 539 | -0.3 bp | fails |
All seven runs failed the line. The one-side choice is the clearest lesson. In-sample, the short side of the book version on NQ was the good one, so the rule kept shorts. Out of sample the shorts lost -14.3 bp per trade while the discarded longs made +16.6 bp on 34 trades. Nobody could have known that in 2018, which is exactly why the choice had to be made without looking. As written it fails, and the changes chosen before we looked fail too. That matches what this site found the first time round.
It agrees with our strategy graveyard, and daily bars make it look worse
Version A is a re-test. Our strategy graveyard already lists Turtle Soup as failing on every market we tried in an earlier research round in April 2026 (S&P 500, Nasdaq and gold futures and long Treasuries), with walk-forward means between -0.04 and -0.40. Tonight's test is stricter about the rules (the book's exact entry, stop, break-even and two-day exit, with intraday fills), and it lands in the same place: not an edge. The out-of-sample Sharpe ratios of the book version, -0.03 on NQ and -0.07 on gold, sit at or inside the top of that old range. For the record, a test of the Turtles' own breakout entry is still on our list; this article is about the trade on the other side of it.
One more check, explored after the fact: what would a daily-bar test of version A have said? A daily bar shows that the low broke and that the high reached the buy stop, but not in which order, so a daily test has to assume the good order every time. It books 232 trades on NQ instead of 152, 80 more, and 174 on gold instead of 101. Most of the extra ones are days when the high came first and the order could never have been filled. With them, the average trade is -29.0 bp on NQ and -25.5 bp on gold. So a daily-bar test of this setup makes it look worse than it is, not better. It is still a loser either way, but the order of events inside the bar is the whole trade, and the only way to know it is to look inside the bar.
Lab notes
The test was registered on 2026-10-15 and run unattended early on November 3. Two things stopped me on the way. The first draft of the trade chart picked a June 2024 sweep where price poked through the prior high by about one tick, so the stop and the entry were a few points apart and the trade was invisible on the chart. Choosing "a typical trade" by eye is how cherry-picking starts, so the chart now picks by rule: the most common outcome, in 2024, with the risk closest to the median. Second, in the improvement menu, three volatility lookbacks gave gold the same in-sample Sharpe to two decimals. That smells like a bug, so I printed the raw values. They differed in the third decimal. Not a bug, just a flat result.
So is Turtle Soup dead? The idea underneath it, that obvious levels attract stops and failed breaks reverse, is true often enough to look convincing on any chart you pick. Measured over every occurrence, with fills that could really happen, it doesn't pay on these two markets. If you trade sweeps of the prior day's high and low, this is the base rate your discretion has to beat.
Get the Turtle Soup rules + the Python code (PDF)
Every rule from this test on one page, the results table, and standalone Python you can run on your own data. Free, by email.
Instant delivery. One PDF, no spam. Unsubscribe anytime.
FAQ
What is the Turtle Soup trading strategy?
It is a failed-breakout trade from Linda Bradford Raschke and Laurence Connors' book Street Smarts (1995). When a market breaks below its 20-day low, and that low was set at least four sessions earlier, you wait for the break to fail and buy just above the old low, with a tight stop under the day's low. The short is the mirror image at the 20-day high. The name is a nod to the Turtle traders, who bought those same breakouts.
What is ICT turtle soup?
It is how the ICT community reads the same idea: a liquidity sweep. Price runs the stops above an obvious high or below an obvious low, such as the previous day's, and then closes back inside the range. The trade goes the other way, with the stop beyond the sweep. In our version: the prior day's high or low, a 5-minute close back inside, a 2R target and flat before the close.
Does the turtle soup strategy work?
Not in our test. On NQ and gold futures from 2010 to 2026, with intraday fills and a 0.01% round-trip cost, all four combinations of version and market had a negative average trade out of sample (2019-2026). The book version was close to break-even (-0.8 bp and -1.9 bp per trade). The ICT sweep traded 172 times a year on NQ and lost 31.1% over the full period. Gold looked strong in-sample (Sharpe 0.55) and did not hold.
Is there a turtle soup strategy PDF?
Yes. EdgeLab's free PDF has every rule of both versions as tested, the results table, and standalone Python code you can run on your own intraday data. It is sent by email from the signup box in the article.

Robin Eriksson
Founder of EdgeLab. Five years of discretionary losses taught me to test everything — now I publish the strategies that survive. About me →
Related: Linda Raschke's Holy Grail trading strategy, tested: as written, it almost never trades · ICT Silver Bullet strategy: what 16 years of Nasdaq futures say about its win rate · We asked AI for 10 trading strategies and backtested every one