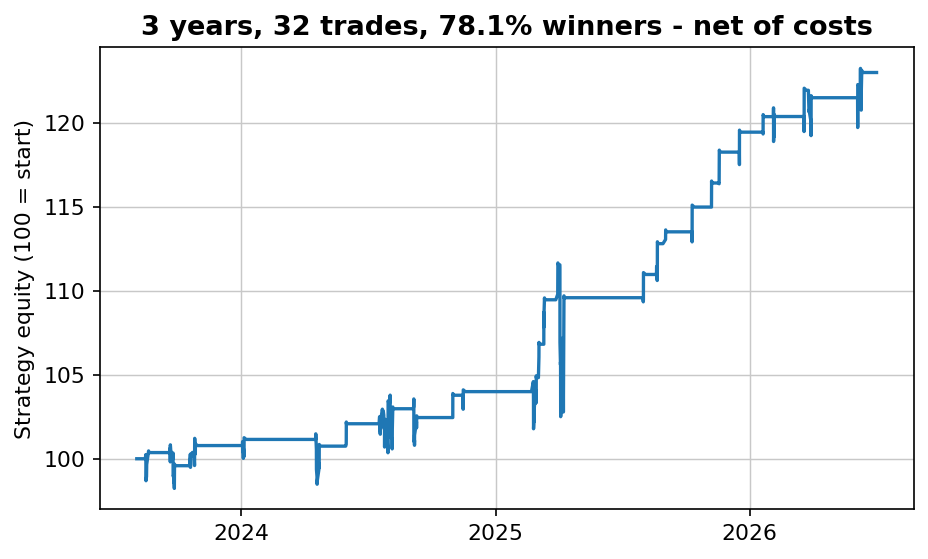
The short version: yes, it works after costs. On QQQ out of sample (2013 to June 2026) the rule made 156 trades, won 75.0% of them and averaged +0.89% per trade after 0.05% per side, with a profit factor of 2.93 and a Sharpe of 0.94. The pre-registered failure line was a profit factor below 1.2 or a Sharpe below 0.3, so it cleared both with room to spare. SPY and Nasdaq futures passed too, and all 24 settings we tried on QQQ passed. And one honest catch: since 2013, plain buy and hold on QQQ made +1114.0%. The %R rule made +284.2%.
Two rules, written down before the first trade
I've read Larry Williams, along with Connors, Raschke and Alvarez, and their books helped me a lot. That is exactly why I test them the same way as everything else. Williams introduced %R in How I Made One Million Dollars Last Year Trading Commodities (1973). It answers one question: where did today close inside the range of the last n days? 0 means at the top, -100 at the very bottom.
The Williams %R strategy that circulates on trading sites is a two-rule short-term version, often passed around with a claim of roughly seven winners in ten. I didn't copy anyone's text or numbers; I took the rules:
- Buy: when %R(5) closes below -90, buy at that close.
- Sell: at the close of the first day whose close is above the previous day's high.
No stop, no target, long only, one position at a time. The test was registered on 2026-10-15, almost a month before it ran: QQQ from 1999 as the main market, SPY from 1993 and Nasdaq-100 futures (NQ, regular-session daily bars) from 2010 as checks. In-sample to the end of 2012, out-of-sample from 2013. Costs of 0.05% per side on the ETFs, two to three times what a retail trader pays, and 0.01% round trip on the futures, the same as in our opening range breakout test. The futures hold overnight, so the continuous NQ series was first adjusted for its 53 contract rolls, which would otherwise show up as moves that never happened. The failure line: a QQQ out-of-sample profit factor below 1.2 or Sharpe below 0.3.
One detail matters for anyone who wants to trade this. The rule buys at the close using that same close. In practice that means computing %R a few minutes before the bell and sending a market-on-close order. I come back to what happens if you buy the next morning instead. First, the numbers.
It held out of sample on all three markets
| Net of costs | QQQ in-sample 1999-2012 | QQQ out-of-sample 2013-2026 | SPY out-of-sample | NQ futures out-of-sample |
|---|---|---|---|---|
| Trades | 202 | 156 | 152 | 156 |
| Win rate | 69.3% | 75.0% | 77.0% | 76.9% |
| Average trade | +0.79% | +0.89% | +0.49% | +0.87% |
| Median trade | +0.88% | +1.15% | +0.80% | +1.22% |
| Profit factor | 2.05 | 2.93 | 2.17 | 2.78 |
| CAGR | +11.37% | +10.54% | +5.55% | +10.44% |
| Max drawdown | -26.1% | -15.4% | -16.8% | -15.6% |
| Time in market | 24.5% | 16.8% | 15.6% | 17.1% |
| Sharpe (daily, annualised) | 0.65 | 0.94 | 0.61 | 0.91 |
| Buy and hold: Sharpe / max drawdown | 0.23 / -83.0% | 1.00 / -35.1% | 0.91 / -33.7% | 0.83 / -36.2% |
The second half was better than the first: QQQ's Sharpe went from 0.65 to 0.94, and the win rate from 69.3% to 75.0%. The average trade lasts 3.6 days out of sample, and there are about 11.6 of them a year. SPY in-sample started in 1993 and looked much the same (Sharpe 0.68, 270 trades). The NQ futures in-sample period is short, 29 trades from mid-2010 to 2012 with a Sharpe of 0.24, but out of sample the futures behave almost exactly like QQQ: the daily returns of the two correlate 0.97. That is what you expect, since they are the same index.
Year by year on QQQ, 27 of the 28 calendar years were positive, and 13 of the 14 out-of-sample years:
| QQQ, out of sample | Return | Trades | Win rate |
|---|---|---|---|
| 2013 | +18.5% | 13 | 85% |
| 2014 | +6.4% | 13 | 77% |
| 2015 | +7.8% | 12 | 75% |
| 2016 | +9.8% | 12 | 75% |
| 2017 | +5.8% | 6 | 83% |
| 2018 | -2.8% | 9 | 56% |
| 2019 | +11.3% | 7 | 86% |
| 2020 | +38.9% | 10 | 80% |
| 2021 | +13.0% | 14 | 86% |
| 2022 | +1.9% | 22 | 45% |
| 2023 | +8.6% | 11 | 73% |
| 2024 | +14.2% | 12 | 83% |
| 2025 | +6.5% | 10 | 90% |
| 2026 (to June 9) | +6.4% | 5 | 100% |
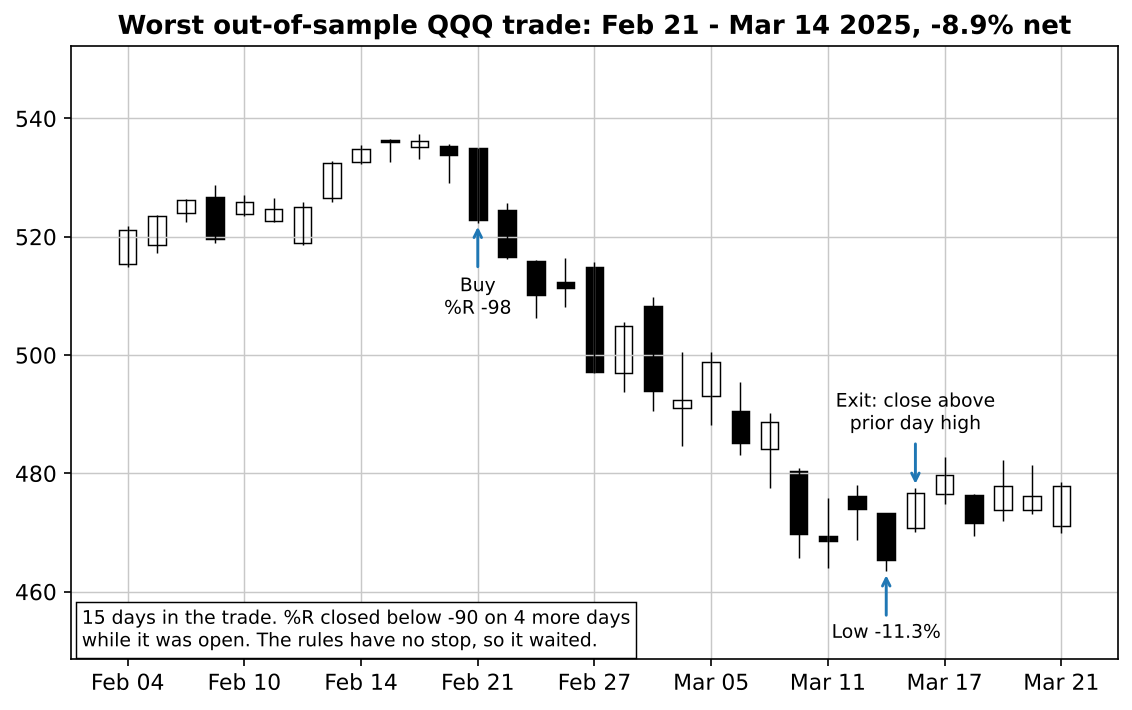
Study 2022 first. The rule traded more than in any other year, 22 times, and lost more often than it won (45%), yet still finished up. A falling market keeps producing oversold closes, and a dip-buyer keeps buying them. Even so, a good average can hide one ugly trade, so here is the worst one.
There is no stop, and you will feel it
This is the cost of a rule with no stop. Out of sample, 4 QQQ trades lost more than 5%, against a best trade of +8.61%. Most of the time the wait is short, 3.6 days on average. But when the market keeps sliding, the rule just holds. It doesn't add, and it doesn't get out, until a single up-close above yesterday's high lets it go.
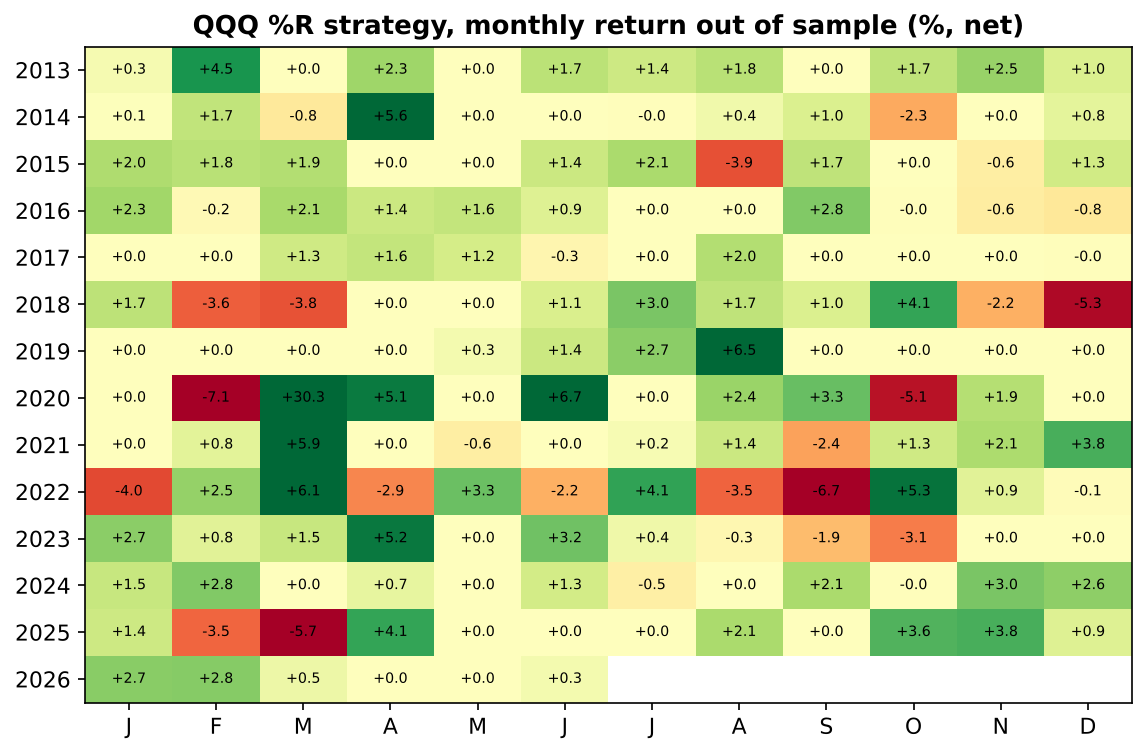
The month grid shows how that adds up. Lots of quiet green, a few red months, and in March 2020 one month that made +30.3%, because the rule bought into the crash and the rebound paid the exit.
The QQQ position open at the end of the data (June 9, 2026) is marked at that day's close. The rule survived its worst moments, then. The next question is whether it only survives at exactly 5 days and -90.
Every one of the 24 settings passed
A rule that only works at one setting is a rule fitted to the past. So the registration fixed a grid in advance: lookbacks of 2, 3, 5, 7, 10 and 14 days against buy thresholds of -80, -85, -90 and -95.
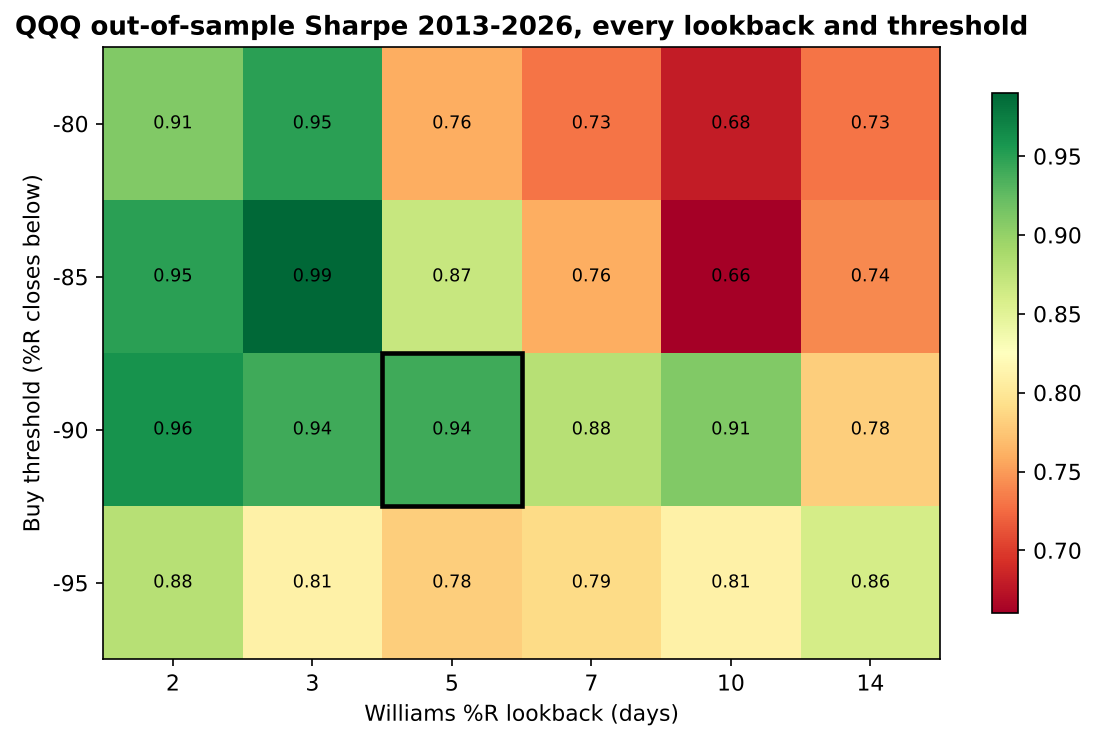
That is a plateau, not a peak. Shorter lookbacks and the -85 and -90 thresholds do a little better, but the differences are small and there is no cliff anywhere. If you already use %R(14) at -80, the out-of-sample Sharpe was 0.73, not zero. Costs are the next thing that kills short-term rules, so I raised them.
Costs barely touch it on futures, and halve it on SPY at 4x
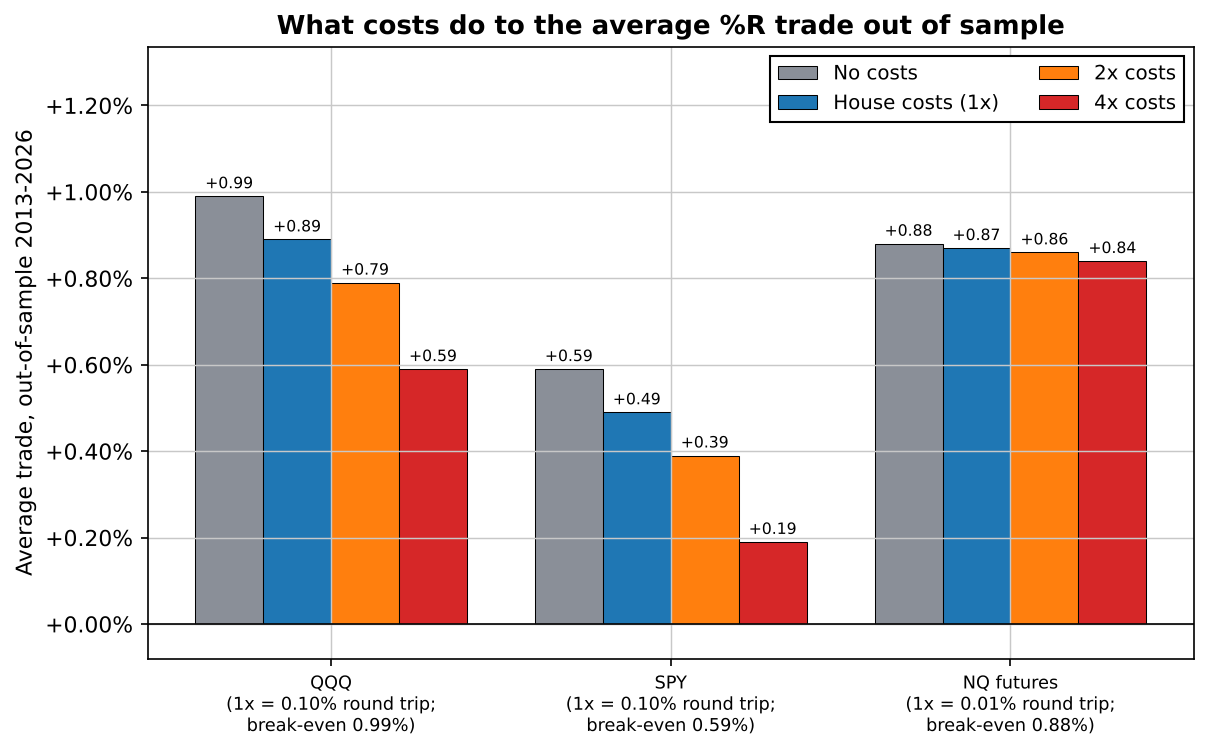
The average QQQ trade made +0.99% before costs, so it would take a round trip of 0.99%, 9.9 times our already pessimistic house cost, to reduce it to nothing. At 4x costs QQQ still has a Sharpe of 0.65 and a profit factor of 2.09. NQ futures barely notice: +0.84% per trade even at 4x, with a break-even 88.2 times the cost used. SPY is the weak spot. Its average trade is smaller (+0.59% before costs), and at 4x its Sharpe falls to 0.26, under the 0.3 bar we set for QQQ. Nobody trading SPY pays four times our cost today, but it shows where the margin is thinnest. So the rule works. What it does not do is beat the market it trades.
It loses to buy and hold on the Nasdaq, and that is the honest catch
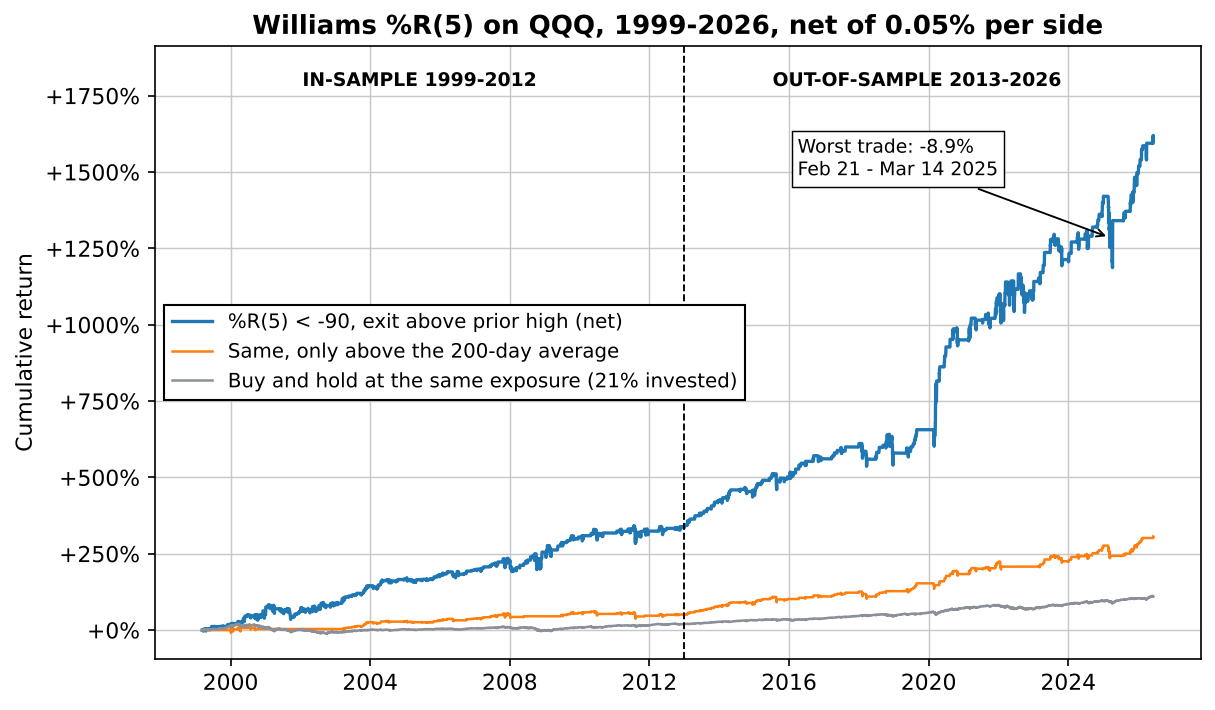
Since 2013, QQQ itself returned +1114.0%, a CAGR of +20.43% and a Sharpe of 1.00. The %R rule returned +284.2%, a CAGR of +10.54% and a Sharpe of 0.94. On risk-adjusted terms that is close, and the rule's worst drawdown was less than half of buy and hold's (-15.4% against -35.1%). But it is invested only 16.8% of the days, and in a market that went up most of the time, being out is expensive.
That is why the first chart compares it with buy and hold at the same exposure: hold QQQ with a fifth of the money, every day, and you end the full period at +109.9% against the rule's +1600.2%. Per day in the market, the rule earns far more. It is a way of being in the market for a fraction of the time and still catching most of the bounces. Over the whole 27 years, which include the 2000-2002 crash where buy and hold fell -83.0%, the rule (+1600.2%) even finished ahead of holding QQQ (+1543.3%). Since 2013, it hasn't.
So should you add the classic 200-day filter, the fix everyone suggests? That was the one improvement I registered in advance.
The 200-day filter cuts the drawdown and the return
The registered version: take the signal only when QQQ closes above its 200-day average. Out of sample it did what a trend filter does. Sharpe 0.98 instead of 0.94, max drawdown -11.0% instead of -15.4%, win rate 78.8%, 118 trades. But the CAGR fell from +10.54% to +7.59%, and in-sample, from 1999 to 2012, it halved the Sharpe, from 0.65 to 0.35. The filter cut the in-sample trades from 202 to 96, and many of the ones it removed were bounces inside the 2000-2002 and 2008 bear markets. On SPY it gave 0.72 out of sample, on NQ 0.91. It passes the line, but it isn't a clear upgrade: you trade less return for a smaller drawdown. Then there was the menu.
One change, chosen on old data only, held up
Every strategy article now also runs the site's standard list of possible improvements. It is a separate protocol from this test's registration, and its current version (2026-11-08) was fixed before this run. The selection uses in-sample data only: every bar after December 2012 is deleted before any variant or indicator is computed. An item is kept if it raises the in-sample Sharpe by at least 0.10 on average over the three markets and beats the base rule in at least 70% of its settings; at most two are kept. Only then are the kept ones run out of sample, once, with the same costs and the same failure line. Seven items apply to a long-only daily dip-buyer, tried in 49 settings. The base rule's in-sample Sharpe was 0.65 on QQQ, 0.68 on SPY and 0.24 on NQ (mid-2010 to 2012 only):
| Menu item (in-sample only, to 2012) | Change in Sharpe | Share of settings better | Kept? |
|---|---|---|---|
| Trend filter (previous close above its 150/200/250-day average, exit when it flips) | -0.26 | 22% | no |
| Only after fear (VIX above its 10/20/40-day average) | +0.12 | 67% | no (too few settings better) |
| Volatility-scaled size (10/20/40-day volatility, at most 2x) | +0.17 | 100% | kept |
| Fixed holding time (5/10/15 days) instead of the exit | -0.30 | 22% | no |
| ATR stop (2/3/4 x ATR) | -0.03 | 33% | no |
| No position on Fed decision days (calendar from 2010) | -0.06 | 33% | no |
| All three markets together, equal risk | +0.13 | 67% | no (too few markets better) |
| Calm market only, one side only, distance from VWAP | do not apply (the menu excludes mean reversion, long-only or daily strategies from these) | ||
"Change in Sharpe" is the in-sample gain at the menu's default setting, averaged over the markets. The ATR stop is worth a second look: at the tight setting it roughly halved the in-sample Sharpe on QQQ and SPY, the usual fate of stops on a mean-reversion trade that needs room. Only volatility-scaled size passed: when recent volatility is low, the position grows (up to 2x); when it is high, it shrinks. Out of sample, run once:
| Volatility-scaled size | In-sample Sharpe | Out-of-sample Sharpe | Out-of-sample max drawdown | Out-of-sample CAGR | Base rule out of sample |
|---|---|---|---|---|---|
| QQQ | 0.75 | 1.09 | -12.8% | +11.05% | 0.94 / -15.4% |
| SPY | 0.70 | 0.73 | -14.5% | +5.66% | 0.61 / -16.8% |
| NQ futures | 0.62 | 1.04 | -11.4% | +8.66% | 0.91 / -15.6% |
Two caveats before the result. The in-sample gain was uneven: +0.10 on QQQ, +0.02 on SPY and +0.38 on NQ, whose in-sample window is only 29 trades, so NQ carried the average over the bar. And part of the effect is simply more size in calm markets. With that said, it held on all three: a higher Sharpe and a smaller drawdown than the base rule after 2012, with the same trades, just sized differently. The price is leverage. The average QQQ position was 1.12 times the account and the largest 2.0 times, so on ETFs it needs margin; on futures it is simply more or fewer contracts. It is an improvement, not a different strategy, and the choice was made before anyone looked at 2013 onwards. Which leaves the practical question of how this sits next to the dip-buyers this site has already tested.
It is a cousin of RSI(2), not a new idea
%R, Connors' RSI(2) and our RSI 30/40 rule all buy a short, sharp drop and sell the bounce. To see how much they overlap, I rebuilt the other two for this run: RSI(2) below 10 above the 200-day average, out above 70, on QQQ daily bars; and RSI(14) at or below 30, out at or above 40, on the 2-hour NQ bars, summed per day. From June 2010 to April 2026:
- %R and RSI(2) on QQQ: correlation of daily returns 0.54. On 58% of the days %R was in the market, RSI(2) was too.
- %R on QQQ and RSI 30/40 on NQ: 0.62 (0.63 with %R on NQ).
- For reference, RSI(2) and RSI 30/40: 0.44.
So the %R rule is closer to RSI 30/40 than RSI(2) is. Running all three is not three strategies. It is one bet on oversold dips, placed three times. There was one more thing I had to check before trusting any of this.
Buying the next morning instead still passes, with less
Explored after the fact, not part of the registration: what if you can't send a market-on-close order and buy at the next day's open instead, with the same exit? On QQQ out of sample the Sharpe drops from 0.94 to 0.81, the average trade from +0.89% to +0.71%, and the profit factor to 2.66. SPY gives 0.59 and NQ 0.78. Weaker, as you'd expect when part of the bounce happens overnight, but still well above the failure line. The edge doesn't depend on a perfect fill at the exact close.
Lab notes
The test was registered on 2026-10-15 and ran unattended early on November 13. One thing to own up to. My first run read the volatility-sizing item slightly wrong: it set the size target from the median of the same 10-, 20- or 40-day volatility it was scaling by, while the menu says the target is the median of the 20-day volatility. I changed it to the written definition and ran everything again. The first run had already printed out-of-sample numbers for the kept item, so to be plain about it: the fix was to match the menu's wording, not to improve a result, and the in-sample pick did not change (volatility sizing was the only item kept either way), and the numbers above are from the corrected run. In the same check, the three volatility lookbacks gave QQQ the same in-sample Sharpe to two decimals, 0.75. That looked like a bug, so I printed the raw values. They differ in the third decimal. Not a bug, just a flat result.
So does the Williams %R strategy work? On the Nasdaq, over 27 years and after costs, yes: it passed a line set in advance, on three markets, at every setting in the grid, and it survived double costs. What it won't do is make you richer than holding the index in a long bull market. It is a strategy for someone who wants to be out of the market most of the time, take a few short trades a month, and let one closing order do the watching.
Get the Williams %R rules + the Python code (PDF)
Every rule from this test on one page, the results table, and standalone Python you can run on your own data. Free, by email.
Instant delivery. One PDF, no spam. Unsubscribe anytime.
FAQ
What is the Williams %R trading strategy?
Williams %R is an oscillator Larry Williams published in 1973. It shows where today's close sits inside the range of the last n days, from 0 (the top) to -100 (the bottom). The short-term strategy tested here has two rules: when %R(5) closes below -90, buy at the close; sell at the close of the first day that closes above the previous day's high. There is no stop and no target.
Does the Williams %R strategy work?
In our pre-registered backtest, yes, after costs. On QQQ out of sample (2013 to June 2026) it made 156 trades, won 75.0% of them, averaged +0.89% per trade after 0.05% per side, and had a profit factor of 2.93 and a Sharpe of 0.94. SPY and Nasdaq-100 futures passed too, and so did all 24 lookback and threshold settings on QQQ. The catch: it is in the market only 16.8% of the time, so it made far less money than simply holding QQQ (+284.2% against +1114.0%), with a much smaller drawdown (-15.4% against -35.1%).
What are the best Williams %R settings?
There is no single best one, and that is the good news. We tested lookbacks of 2, 3, 5, 7, 10 and 14 days against buy thresholds of -80, -85, -90 and -95. On QQQ out of sample every one of the 24 settings had a Sharpe between 0.66 and 0.99 and passed our failure line. The classic 5-day, -90 setting scored 0.94. Picking the top cell after the fact would only add hindsight.
Is Williams %R better than RSI(2)?
They are close cousins rather than rivals. From 2010 to 2026 the daily returns of the %R rule on QQQ correlated 0.54 with an RSI(2) rule on QQQ and 0.62 with our RSI 30/40 rule on 2-hour Nasdaq futures bars, and 58% of the days the %R rule was invested, the RSI(2) rule was invested too. Running both mostly doubles the same bet on oversold dips.
Is there a Williams %R strategy PDF?
Yes. EdgeLab's free PDF has every rule as tested, the results table and standalone Python code you can run on your own daily data. It is sent by email from the signup box in the article.

Robin Eriksson
Founder of EdgeLab. Five years of discretionary losses taught me to test everything — now I publish the strategies that survive. About me →
Related: Almost all of the Nasdaq's return happens while you sleep. Can you trade it? · Does Connors' RSI(2) still work? We tested it on the Nasdaq · VWAP strategies on Nasdaq futures: 16 years of one-minute data