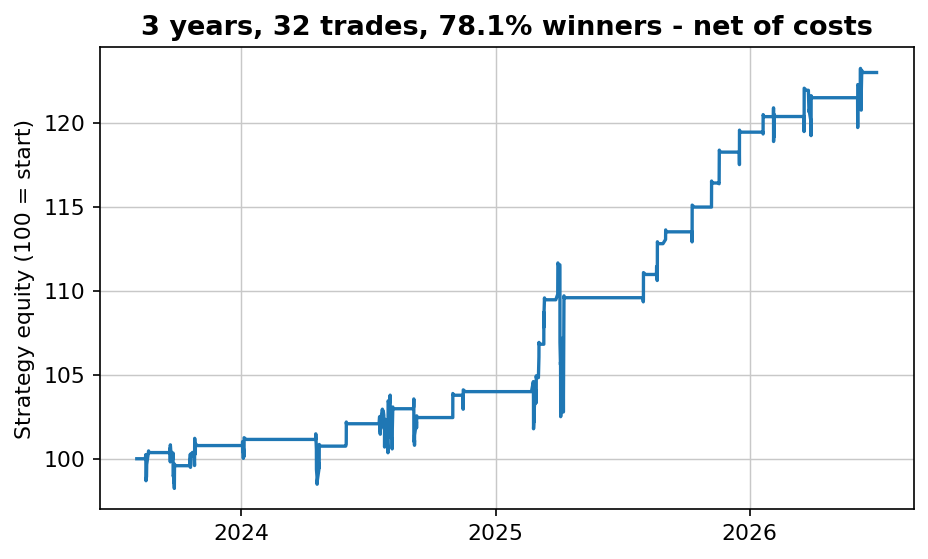
The short version: don't decide a strategy is dead by feel — pre-commit three measurable tripwires and check them live. (1) Rolling 12-month Sharpe stays below a floor for a sustained stretch, not one dip. (2) Live drawdown breaches the strategy's own Monte Carlo 95th-percentile envelope — deeper than its bad-luck distribution allows. (3) The trade-return distribution shifts shape (win rate and mean drifting from history). One firing means investigate; two firing together means cut size. We demonstrate all three on a real RSI(2) record below — where, tellingly, the tripwires say the strategy is fine, and one even shows it quietly improved.
The reason this matters isn't philosophical, it's financial: the natural human response to a drawdown is to abandon the strategy at the bottom, which is often the worst possible moment. A strategy's worst drawdown is usually still ahead of it, and if you don't know the difference between "normal bad" and "actually broken," you will keep cutting healthy strategies at their lows and calling it discipline. Tripwires replace the feeling with a number you agreed to before the pain started.
Throughout, the worked example is the RSI(2) dip-buyer on QQQ from our frozen cache — 523 trades over 23 years, full-sample Sharpe 0.87 (stronger, ~1.20, in the out-of-sample decade), net of costs. Worth heading off a fair question: our strategy graveyard lists an RSI variant as dead — that's the TPS scale-in version on futures, which collapsed out-of-sample. Plain RSI(2) mean reversion on a liquid index like QQQ is a different job and a genuine survivor, which is exactly why it's a fair thing to run tripwires on. Same indicator, opposite verdicts, and both are true.
Tripwire 1: the rolling Sharpe, and why one dip is noise
The most intuitive death signal is the edge simply fading — returns getting smaller relative to their volatility. You measure it with a rolling Sharpe ratio over a trailing window (12 months here) and set a floor in advance. The trap everyone falls into: treating a single dip below the floor as the signal. It isn't. Healthy strategies cross below zero constantly — noise guarantees it.
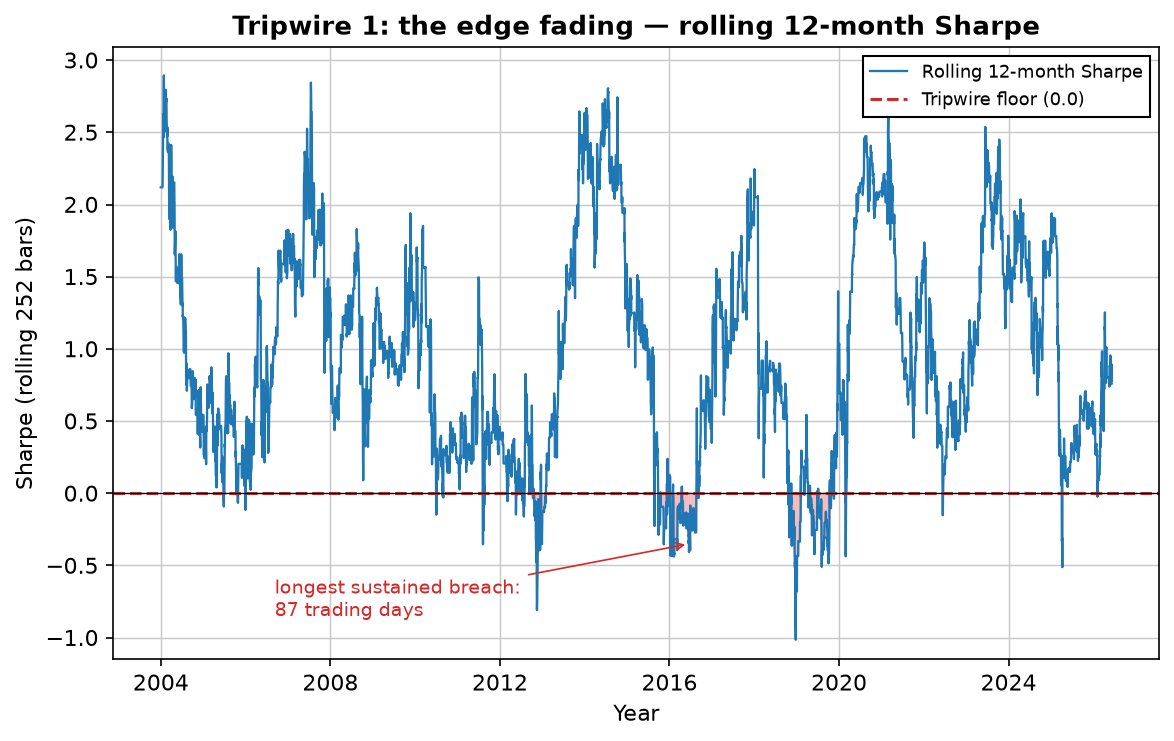
So the rule has two parts: a floor (we use zero — no risk-adjusted edge at all) and a duration (a breach must persist, say, 60+ trading days to count). One without the other is either too jumpy or too slow. On this record the tripwire never fired: every sub-floor stretch healed. That's the calm answer you want most of the time — but a fading Sharpe is the slow death. The next tripwire catches the fast one.
Tripwire 2: a drawdown worse than the strategy's own bad luck
A rolling Sharpe reacts slowly. A sudden, abnormal drawdown is the acute signal — but "abnormal" needs a definition, or you'll panic at every ordinary dip. The clean definition: shuffle the strategy's own historical trades thousands of times and read the 95th-percentile worst drawdown. That's the deep end of what the strategy can do by luck alone (the same reshuffling logic as our Monte Carlo drawdown piece). Draw it as a line on your live equity, and it turns "is this drawdown scary?" into a yes/no you decided in advance.
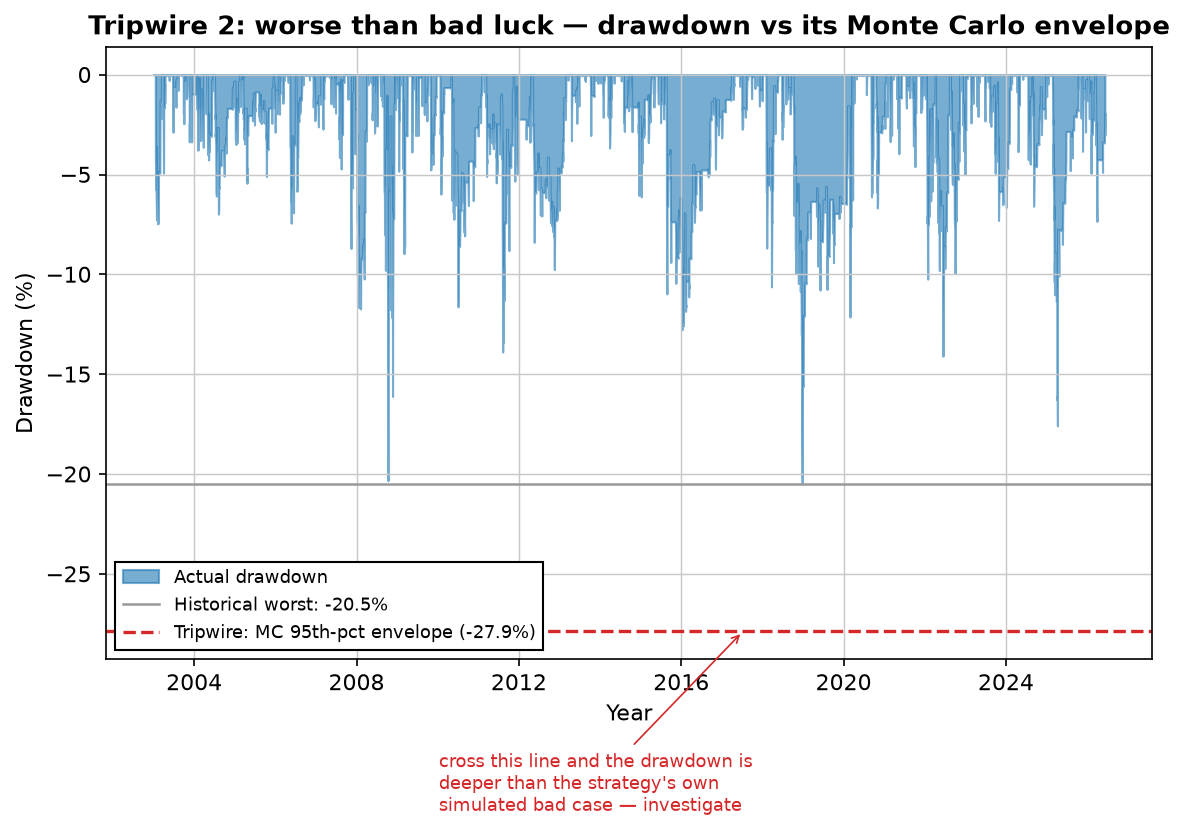
Note the gap between the two lines. History's worst was -20.5%, but the strategy's plausible worst by reshuffling is -27.9%. If you'd set your tripwire at the historical number, you'd fire it during a drawdown the strategy can produce on luck alone. The Monte Carlo envelope is the honest line — and on this record, it was never breached.
Tripwire 3: has the shape of the trades changed?
The subtlest death isn't smaller returns or a bigger drawdown — it's the trade distribution quietly changing character while the equity curve still looks fine. A strategy whose win rate is sliding or whose average trade is shrinking is telling you something before it shows up in the Sharpe. So you compare the recent trade distribution against the historical one, on two numbers: win rate and mean return.
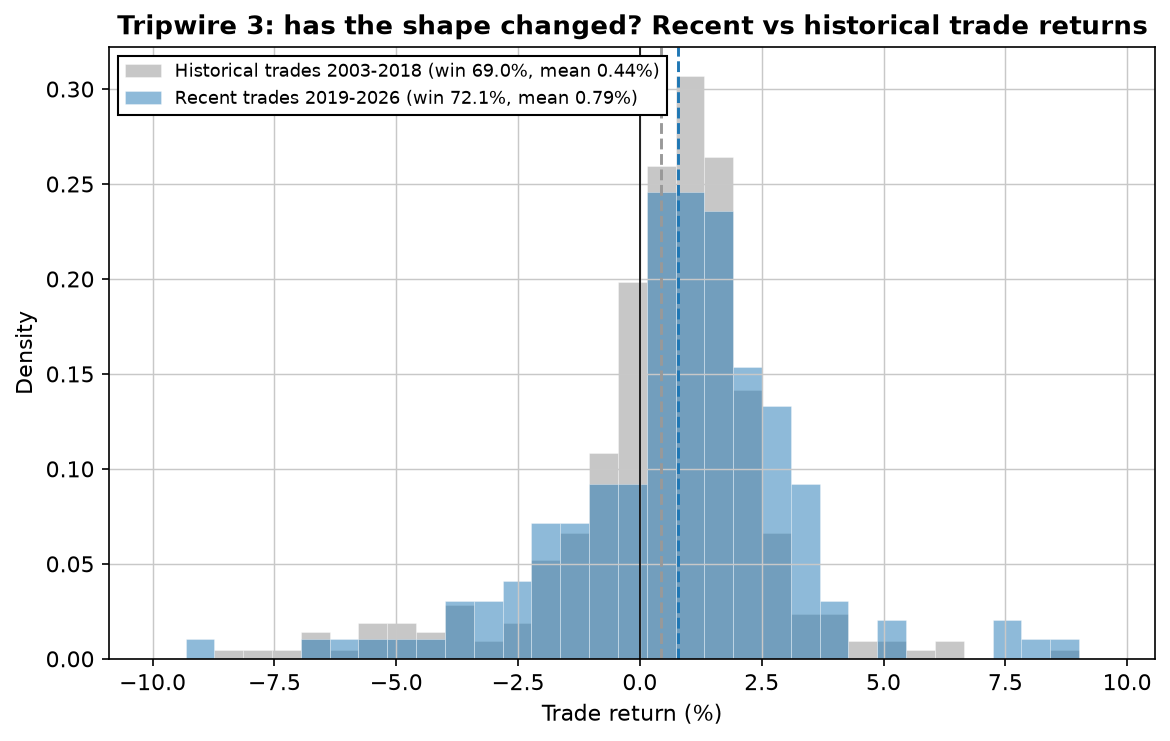
That's the honest twist in this whole worked example: run all three tripwires on RSI(2) and none of them say "dead." One says "actually a bit healthier lately." That's the point of measuring instead of feeling — the tripwires are just as willing to tell you to hold as to fold, and most of the time hold is the correct, unglamorous answer.
How to run them without fooling yourself
- Write the lines down before you trade. A tripwire chosen after the drawdown starts is just rationalization with a chart. Floor, duration, envelope percentile, distribution window — all fixed in advance.
- Require confluence. One tripwire firing is noise-prone; treat it as "investigate." Two firing together — say a sustained Sharpe breach and a distribution shift — is the actual cut-size signal.
- Remember what killed most strategies in the first place. Most edges don't die suddenly; they were never as alive as the backtest claimed. Tripwires protect a live strategy; honest out-of-sample testing stops you deploying a dead one. You need both.
Lab notes
I set the Monte Carlo envelope at seed 7 so the -27.9% reproduces exactly, and I deliberately used the full-history trade pool to build it — which is a small cheat you should know about. In a genuinely live setup you'd only have the trades up to today, so early in a strategy's life the envelope is estimated from fewer trades and is wider and shakier. I've been burned by this personally: I once eyeballed a strategy as "breaking down" during a drawdown that later turned out to be its second-deepest of many normal ones. Building the envelope first, and agreeing to it in writing, is the fix — it's a lot harder to argue with a line you drew last month than with the fear you feel this month.
Download a free strategy
Simple and robust — 70% winners across 155 trades over 16 years, net of costs. The free PDF gives you the market, the timeframe and the exact rules in plain English, plus every single trade it has taken.
Instant delivery. One PDF, no spam. Unsubscribe anytime.
FAQ
How do you know when a strategy has stopped working?
You can't from a single bad month — you pre-commit measurable tripwires and check them live: a sustained rolling-Sharpe breach, a drawdown past the Monte Carlo 95th-percentile envelope, and a shift in the trade-return distribution. One firing = investigate; two together = cut size.
What is a rolling Sharpe tripwire?
Trailing-window Sharpe (12 months) versus a pre-set floor. A single dip is noise; the tripwire fires on a sustained breach. On our RSI(2) example the longest sustained sub-zero stretch was just 87 trading days — not a dead verdict.
How does Monte Carlo flag an abnormal drawdown?
Shuffle the strategy's own trades thousands of times, take the 95th-percentile worst drawdown (here -27.9% vs a -20.5% historical worst), and draw it as a live line. Above it = normal bad luck; below it = deeper than the strategy's own distribution predicts.
Can the tripwires show a strategy improved?
Yes — the distribution tripwire is symmetric. In our example recent trades shifted favourably (win 69%→72%, mean 0.44%→0.79%), which is exactly the kind of change worth detecting even when it's good news.

Robin Eriksson
Founder of EdgeLab. Five years of discretionary losses taught me to test everything — now I publish the strategies that survive. About me →
Related: Your worst drawdown is still ahead of you: 10,000 Monte Carlo reshuffles · Does the 200-day moving average work? Tested on five assets · Why your backtest passes — and your live account doesn't