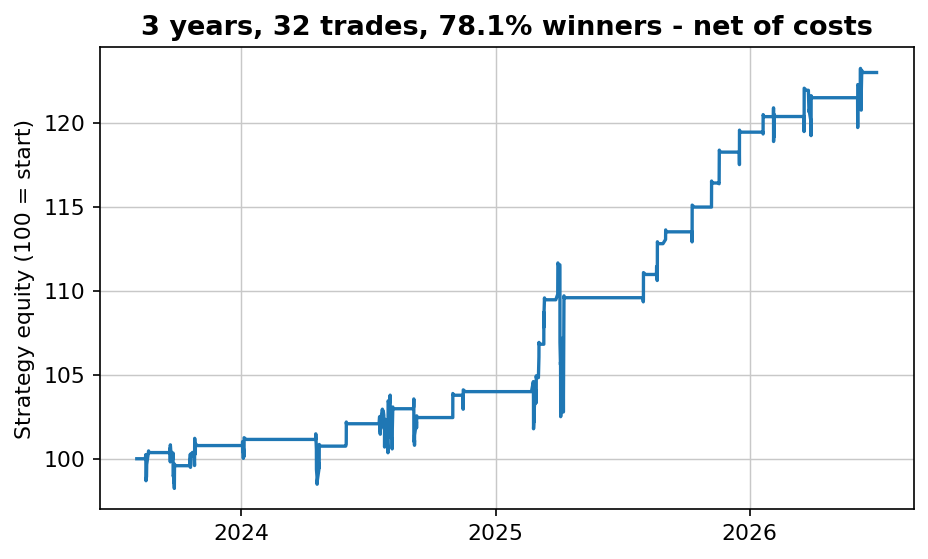
The short version: the historical backtest of our Turnaround Tuesday strategy shows a worst drawdown of -11.3% over 23 years. Reshuffle those same 410 trades 10,000 times and 95% of the reorderings produce a deeper drawdown — the median is -15.7%, the bad tail -23.1%. History dealt one of the luckiest orderings possible. And because the future keeps dealing new orderings, there's a 61% probability of a brand-new worst drawdown within ten years — while the strategy performs exactly as designed. The number you should size against is below, and it isn't the one in the backtest.
A drawdown is just losses that happened to cluster
Maximum drawdown feels like a property of a strategy, like its win rate. It isn't. The win rate belongs to the trades; the drawdown belongs to the order the trades arrived in. History picked one order. It could have picked any other, and the strategy — the rules, the edge, the trades themselves — would be identical.
So we ran the experiment: every Turnaround Tuesday trade from 2003 to 2026 (410 of them, 74.9% winners, +0.61% average, net of 0.05% per side, from our frozen data cache), shuffled 10,000 times with a fixed random seed. Every shuffle contains exactly the same trades, so every path ends at exactly the same +1,000%:
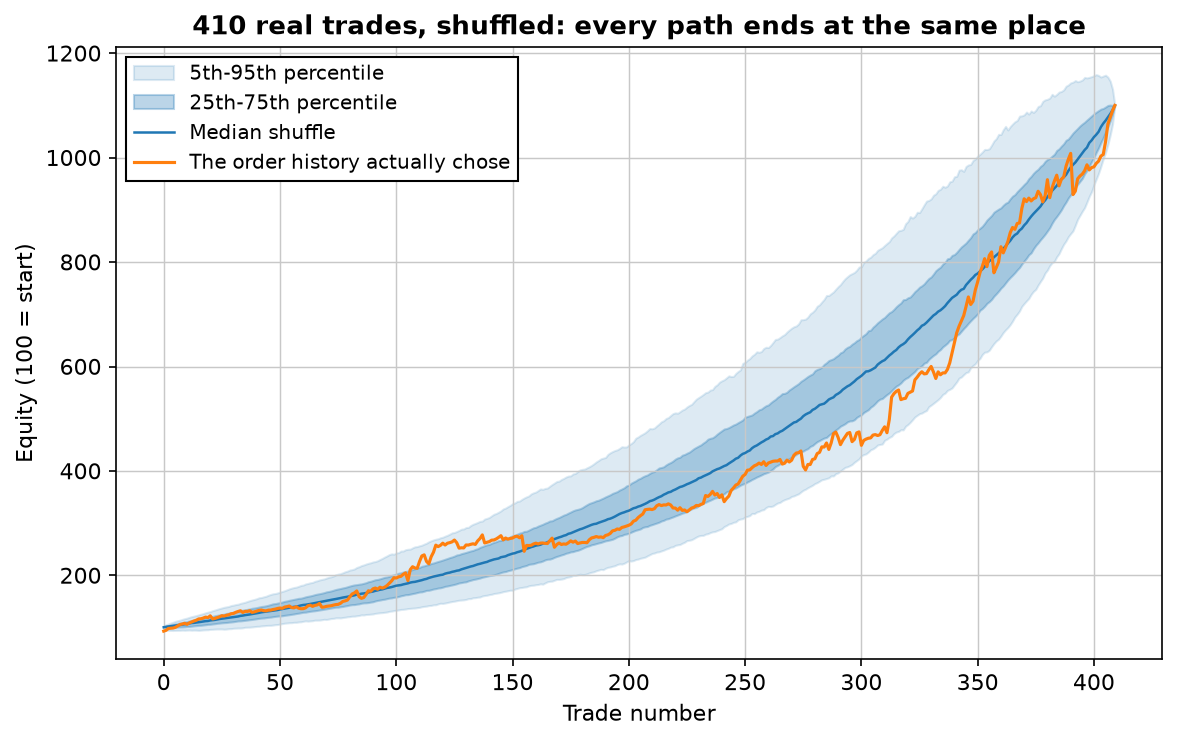
The destination was never in question. The route is where the pain lives — and that's the part the backtest only sampled once.
History's -11.3% was the lucky draw
Here is the max drawdown of each of the 10,000 reorderings:
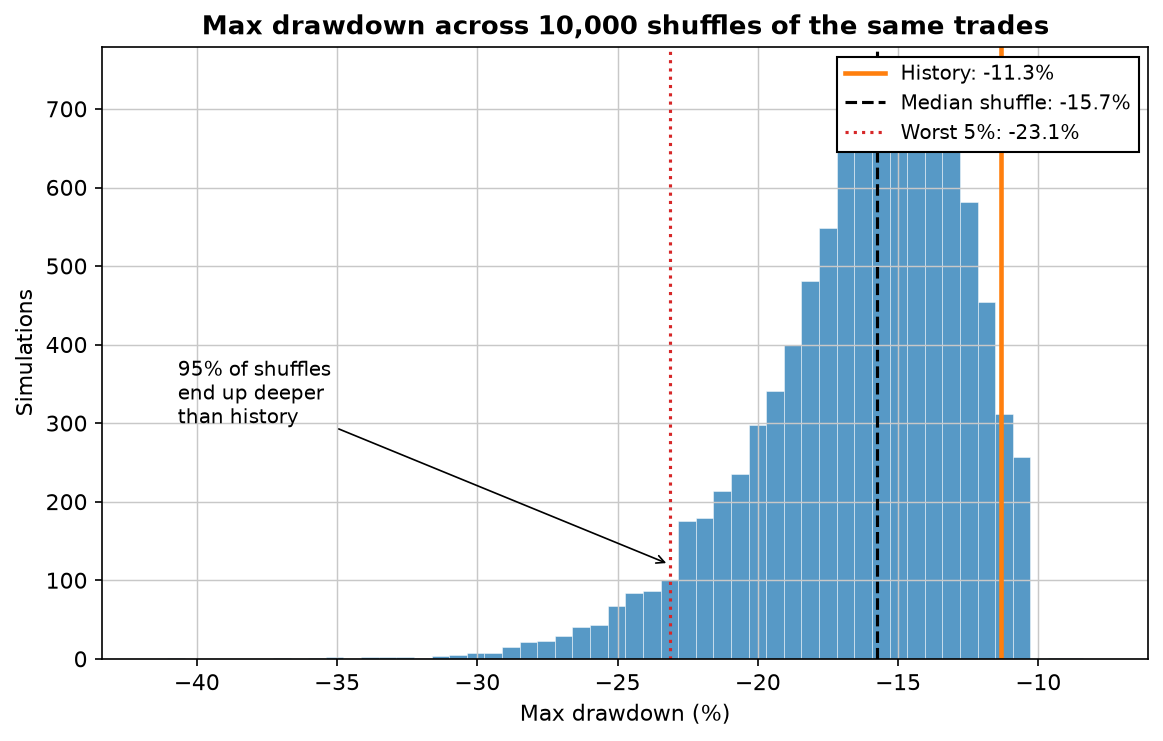
Read the three lines like a skeptic. History: -11.3%. (The strategy article quotes -9.96% — that's the out-of-sample window measured on daily closes; this is the full 23 years at trade level.) Median shuffle: -15.7% — the typical experience of running these exact trades is ~40% more pain than the backtest shows. Worst 5%: -23.1% — one reordering in twenty doubles the reported drawdown. Nothing about the strategy changed in those simulations. Only luck did.
Which raises the uncomfortable question: if history already used up a lucky draw, what does the next decade deal?
There's a 61% chance the record gets broken
We resampled the trade pool forward — one year of trades, two, three, up to ten — 10,000 times per horizon, and counted how often the simulated future produces a drawdown deeper than the historical worst:
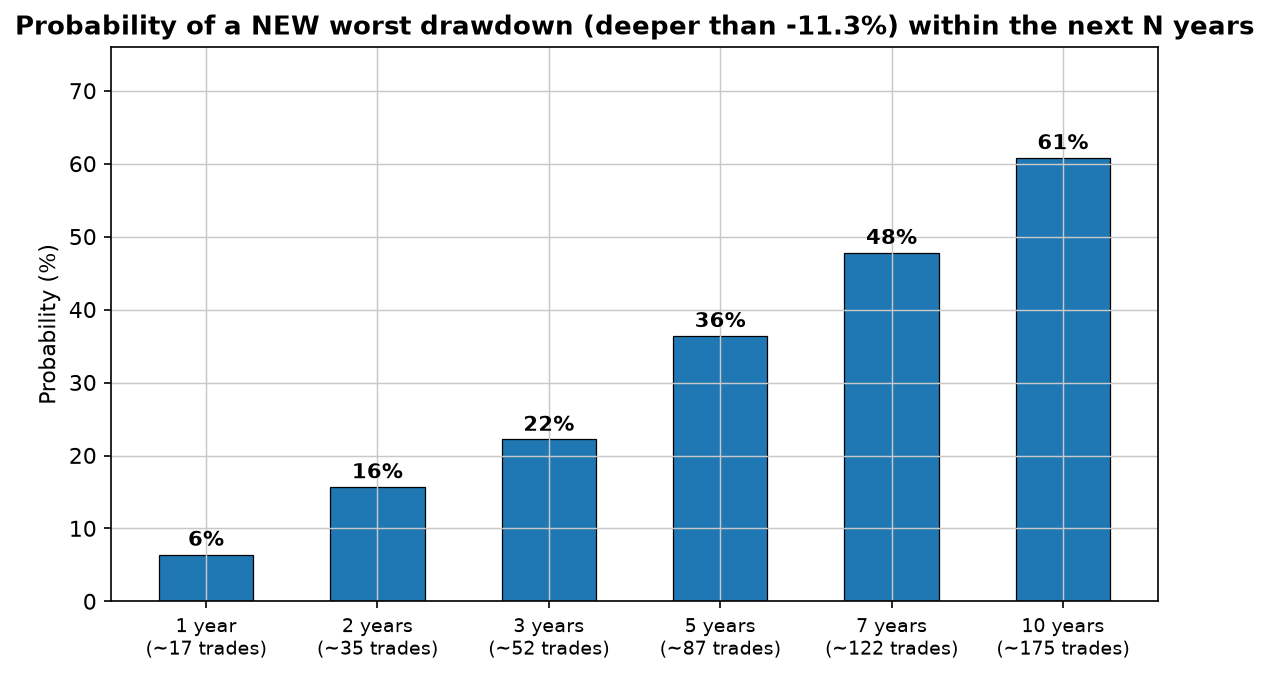
This is the arithmetic behind a line we use a lot: your worst drawdown is still ahead of you. It's not pessimism. Within ten years, the median simulated future contains a -12.4% drawdown — deeper than everything in the 23-year backtest — and there's better-than-even odds of breaking the record outright. The day it happens, nothing will be wrong. That's the point of knowing it in advance: the trader who expects -23% holds through -16%; the trader who expected -11% quits at -13% and calls the strategy dead at precisely the moment it's behaving normally.
What to actually do with these numbers
- Size against the tail, not the history. Take the 5th-percentile simulated drawdown (-23.1% here), decide the worst account drawdown you can genuinely live with, and scale exposure so the two fit. The portfolio math does the same job across strategies.
- Pre-commit your quit line. If simulation says -23% is a normal-bad decade, then -15% is not a reason to abandon ship. Write the number down before you start; panic is not a sizing methodology.
- Rerun the shuffle on anything you're about to trade. It's ~15 lines of Python on top of any trade list, and it's the difference between knowing your strategy and knowing one lucky story about it. The same logic powers our out-of-sample testing — never trust a single draw.
Lab notes
Everything here runs on seed 42, so every number reproduces exactly. One implementation detail worth knowing: the fan chart's percentile bands come from a separate batch of 2,000 shuffles — storing all 10,000 full equity paths would have eaten about 1.6 GB of RAM for no visible difference in the bands, while the drawdown histogram does use all 10,000. And these are trade-level numbers: drawdown inside a 2–3 day hold isn't visible, so every figure in this article understates the real experience slightly. The honest direction of that error makes the conclusion stronger, not weaker.
Download a free strategy
Simple and robust — 70% winners across 155 trades over 16 years, net of costs. The free PDF gives you the market, the timeframe and the exact rules in plain English, plus every single trade it has taken.
Instant delivery. One PDF, no spam. Unsubscribe anytime.
FAQ
What is Monte Carlo analysis in backtesting?
Rerunning the same trade returns thousands of times in random order (or resampling them) and studying the distribution of outcomes instead of the single historical path. The total return doesn't change — the max drawdown distribution is the payoff.
Why does shuffling trade order change the maximum drawdown?
A drawdown is a cluster of losses. History happened to spread the losers out; shuffles eventually put several back-to-back. Median across 10,000 reorderings: -15.7% vs history's -11.3% — and 95% of reorderings were deeper.
How should I use these numbers for position sizing?
Size against the simulated tail (-23.1% here), not the backtest number. Decide the account drawdown you can live with, then scale exposure so tail × exposure fits inside it.
Does a deeper simulated drawdown mean the strategy is broken?
No — every simulation uses the strategy's own profitable trades and ends at the same +1,000%. The edge is untouched; only the realistic worst case on the way there changes. Traders break when they size against history and then meet the distribution.

Robin Eriksson
Founder of EdgeLab. Five years of discretionary losses taught me to test everything — now I publish the strategies that survive. About me →
Related: Does the 200-day moving average work? Tested on five assets · When is a strategy dead? Three statistical tripwires we use · Why your backtest passes — and your live account doesn't