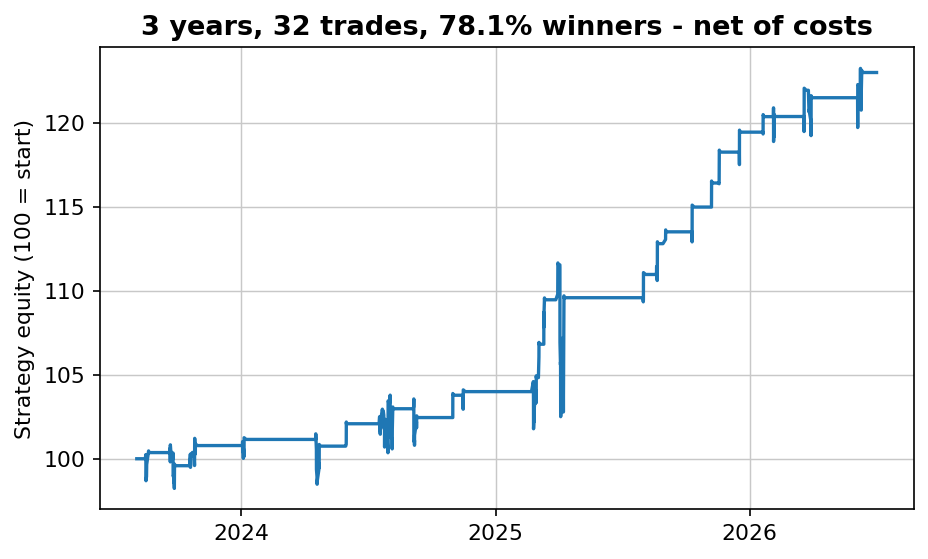
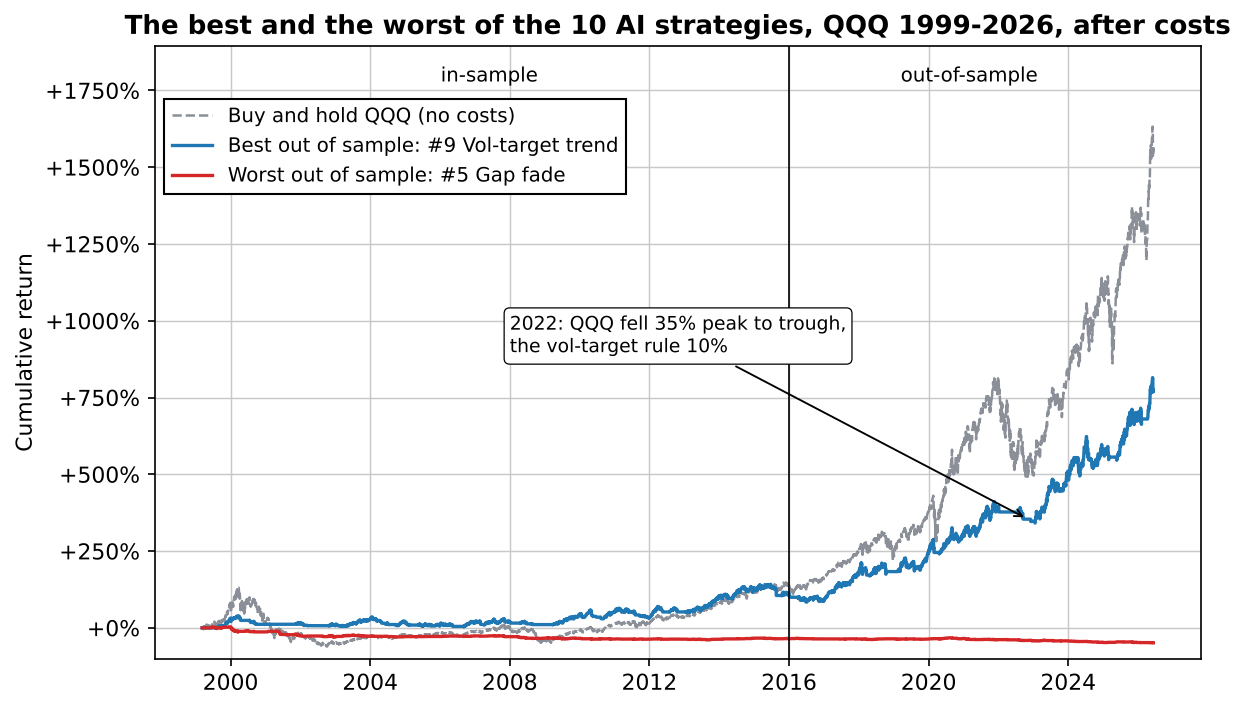
The short version: of the 10 AI trading strategies, 4 survived the bar I set in advance (out-of-sample Sharpe of at least 0.5 and a profit factor of at least 1.2 after costs), 4 were weak and 2 lost money. The best, a volatility-targeted trend rule, made a Sharpe of 1.03 from 2016 to 2026 with a worst drawdown of -14.4%. That is a respectable result for rules written in seconds. And one honest catch: simply holding QQQ made a Sharpe of 0.94 over the same years, and only 2 of the 10 beat it. Both of them are ways of owning the Nasdaq while it goes up.
The AI wrote 10 clean, testable rules in one reply
On October 15 I registered this test: the exact prompt, the data, the in-sample and out-of-sample split, the costs and the pass line. On October 30 a fresh Claude session with no other context (the model was Claude Sonnet 5.5) got the prompt, word for word:
"Give me 10 trading strategies for the Nasdaq-100 (QQQ or NQ futures) with exact, mechanical entry and exit rules that I can backtest. Number them and keep each to a few lines."
The answer came back in one go, and I saved it unedited before running a single backtest. You can read the full AI answer as it arrived. To its credit, it opened with a warning that these are "starting hypotheses to test, not proven edges" and ended with a sensible checklist: test from 2000, split the data, don't optimise, compare with buy and hold. Here are the ten, shortened:
- 200-day trend filter: long at the close when QQQ closes above its 200-day average, cash when it closes below.
- RSI(2) pullback: buy at the close when RSI(2) is below 10 and the close is above the 200-day average; sell when the close is above the 5-day average, or after 7 days.
- Donchian breakout: buy the next open after a close above the 55-day high; sell on a close below the 20-day low. Risk 1% of equity per 2 × ATR(20).
- Opening range breakout on NQ: the 9:30 to 9:45 range on 5-minute bars; trade the first close outside it, stop at the other side, target 2 × the range, flat at 15:55.
- Gap fade: buy the open after a 0.5% to 1.5% gap down if yesterday closed above the 50-day average; sell at the gap fill or the close; stop 1 × ATR(14) below.
- Turn of the month: buy the close of the 5th-to-last trading day, sell the close of the 3rd trading day of the next month.
- Bollinger Band reversion: buy a close below the lower band (20, 2) when above the 200-day average; sell when the close is back above the 20-day average.
- MACD with filters: buy a MACD cross up when the 50-day EMA is above the 200-day EMA and VIX is below 25; sell on a cross down or VIX above 30.
- Volatility-targeted trend: each week, hold min(1.5, 15% ÷ 20-day volatility) of QQQ if it is above its 100-day average, otherwise nothing.
- VIX spike reversal: buy at the close when VIX jumps 20% above its 10-day average and above 25 while QQQ is within 15% of its 52-week high; sell when VIX is back below its average, after 10 days, or on a 7% loss.
Every one of them is testable, which is more than most trading advice manages. None of them is new. They are the classics: Connors-style RSI(2), turtle-style channels, the opening range, turn of the month, Bollinger and MACD. That is not a criticism. An AI gives you the consensus of what it has read, and the consensus is a fine place to start. The question is what happens when a computer has to follow the words exactly.
Even "exact" rules leave choices, and I logged every one
The AI's preamble said signals are taken on the daily close and filled at the next open, unless a rule says "at the close". I followed that, and where the text was still open I took the most literal reading and wrote it down before looking at results:
| Rule | What the text left open | The reading I used |
|---|---|---|
| All | "At the close" versus the next open | Rules 1, 2, 6 and 7 fill at that close, as written; rules 3, 5 and 8 at an open, as the preamble says. Rule 10 at the next open (see its row) |
| 1, 2, 6 | "Optional" lines and a "filter variant" | Not tested: the main rule only. For rule 2's stop the text says "none, or" a stop, so none |
| 3 | Position size | 1% risk ÷ (2 × ATR(20) as % of price), capped at 100% of equity; on average 33.0% invested per trade |
| 4 | Where the 2× target is measured from | From the entry price (the breakout bar's close). Stop and target inside one bar: the stop counts |
| 5 | Gap fill and stop on the same day | Daily bars can't show which came first, so the stop counts |
| 6 | Which day is "5th-to-last" | Counted on QQQ's own trading calendar, which is published in advance apart from rare unplanned closures |
| 7 | Band width, "crosses back above" | Population standard deviation; the first close above the 20-day average |
| 9 | "Weekly", leverage | The last trading day of each week, trend test only then; no interest charged on the part above 1× |
| 10 | "52-week high", timing of the VIX close | Highest daily high of 252 days. VIX settles 15 minutes after QQQ closes, so a QQQ order "at the close" can't see it: every rule 10 entry, exit and stop fills at the next open |
| 2, 3, 5, 7 | RSI and ATR formulas | Wilder's RSI; ATR as the 14-day simple average of the true range |
Costs are 0.05% per side on every QQQ trade, our house level, which is deliberately two to three times what a liquid ETF costs. The NQ futures rule pays 0.01% of price per round trip, the level we used in the opening range breakout article, and I show what happens at 2× and 4× that below. Daily rules run on QQQ from March 1999 to June 2026, with 1999 to 2015 in-sample and 2016 onward out-of-sample. The intraday rule runs on one-minute NQ from June 2010 to April 2026, in-sample to the end of 2017. A stop the market gaps through fills at the open, never at the stop price. The brief defined only the pass line, so before the first run I fixed the other one: a rule fails if it lost money out of sample after costs (a profit factor below 1.0, or a Sharpe of zero or less), and everything between the two lines is weak. With the rules pinned down, here is the scoreboard.
Four of the ten clear the bar, and two lose money
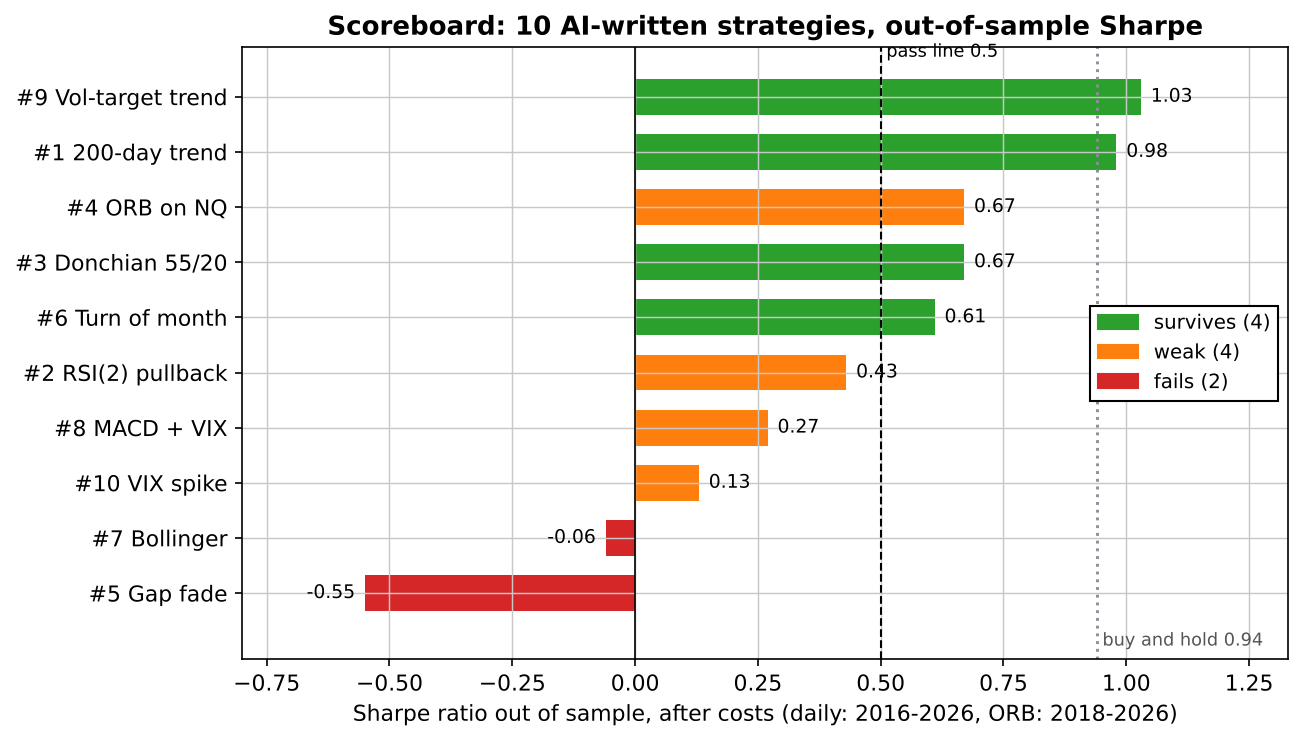
The full out-of-sample record, 2016 to June 2026 (2018 to April 2026 for the NQ rule). A trade's return is the price move after costs; for rule 9 a "trade" is a stretch of weeks with a position, and its return includes the leverage. Sharpe, CAGR and drawdown come from the daily equity, so they include rule 3's position size and rule 9's leverage. One warning on sample size: the Sharpe comes from about ten years of daily returns, but the win rates and profit factors of #1, #3 and #9 rest on only 23 to 26 trades each, so read those columns loosely. Study row #4 first: 2,115 trades, an average of +0.03% each, and a Sharpe that looks fine. Keep that +0.03% in mind for the cost section.
| Out of sample | Trades | Win rate | Avg trade | Median trade | Profit factor | CAGR | Max DD | Time in market | Sharpe | Verdict |
|---|---|---|---|---|---|---|---|---|---|---|
| #1 200-day trend | 26 | 26.9% | +8.16% | -1.66% | 5.90 | +15.8% | -22.9% | 82.8% | 0.98 | survives |
| #2 RSI(2) pullback | 85 | 68.2% | +0.39% | +1.11% | 1.69 | +3.1% | -12.8% | 14.9% | 0.43 | weak |
| #3 Donchian 55/20 | 23 | 65.2% | +4.30% | +2.25% | 4.05 | +2.7% | -6.5% | 57.8% | 0.67 | survives |
| #4 ORB on NQ | 2,115 | 47.0% | +0.03% | -0.08% | 1.11 | +7.5% | -31.6% | 51.9% | 0.67 | weak |
| #5 Gap fade | 221 | 53.8% | -0.10% | +0.13% | 0.74 | -2.3% | -24.4% | 8.4% | -0.55 | fails |
| #6 Turn of the month | 125 | 62.4% | +0.66% | +0.86% | 1.70 | +7.2% | -19.0% | 38.2% | 0.61 | survives |
| #7 Bollinger reversion | 38 | 52.6% | -0.15% | +1.24% | 0.91 | -0.9% | -25.0% | 9.8% | -0.06 | fails |
| #8 MACD + EMA + VIX | 85 | 43.5% | +0.36% | -0.62% | 1.30 | +2.1% | -28.1% | 42.5% | 0.27 | weak |
| #9 Vol-target trend | 23 | 60.9% | +7.18% | +4.12% | 10.05 | +14.6% | -14.4% | 76.7% | 1.03 | survives |
| #10 VIX spike reversal | 24 | 75.0% | +0.39% | +1.39% | 1.31 | +0.7% | -24.8% | 5.0% | 0.13 | weak |
| Buy and hold QQQ | – | – | – | – | – | +20.2% | -35.1% | 100% | 0.94 | benchmark |
Three things stand out. The two failures are both "buy the dip" rules with a hard exit: the gap fade and the Bollinger rule. The RSI(2) rule, the most famous of the dip-buyers, missed the bar at 0.43 while winning 68.2% of its trades. And the two strategies at the top, #9 and #1, hold QQQ for most of the time (76.7% and 82.8% of days) and step aside in downtrends. So the winners on this list are, more or less, buy and hold with an exit. That made me look harder at the period they were tested in.
One more check, explored after the fact. Rules 1, 2, 6 and 7 fill at the same close that triggers them, which a real market-on-close order can only approximate, because it has to be sent a few minutes before the close. Moved to the next open, the 200-day rule still survives (out-of-sample Sharpe 0.95, profit factor 5.32), turn of the month lands exactly on the line (0.50), the RSI(2) rule drops to 0.34 and stays weak, and the Bollinger rule improves from a loss to weak (0.04). No survivor turns into a failure, but the count is not set in stone either.
Out of sample was the easy half
The usual story of a backtest is a strategy that looks great in-sample and then falls apart on new data. This test shows the opposite, and that is not good news either. Here are the same ten in the in-sample years, 1999 to 2015 for the daily rules, 2010 to 2017 for NQ:
| In-sample | Trades | Win rate | Avg trade | Median trade | Profit factor | CAGR | Max DD | Time in market | Sharpe | Positive years, all |
|---|---|---|---|---|---|---|---|---|---|---|
| #1 200-day trend | 68 | 16.2% | +1.03% | -1.34% | 1.59 | +2.7% | -58.9% | 66.7% | 0.24 | 19 of 28 |
| #2 RSI(2) pullback | 124 | 68.5% | +0.45% | +0.87% | 1.76 | +3.1% | -16.4% | 13.3% | 0.39 | 19 of 28 |
| #3 Donchian 55/20 | 40 | 47.5% | +1.13% | -0.32% | 1.41 | +1.1% | -14.3% | 44.4% | 0.34 | 18 of 28 |
| #4 ORB on NQ | 1,928 | 43.1% | -0.01% | -0.14% | 0.94 | -3.7% | -34.5% | 49.3% | -0.41 | 10 of 17 |
| #5 Gap fade | 323 | 59.4% | -0.13% | +0.44% | 0.76 | -2.5% | -41.0% | 7.6% | -0.47 | 8 of 28 |
| #6 Turn of the month | 202 | 58.4% | +0.47% | +0.66% | 1.34 | +4.7% | -52.4% | 38.1% | 0.35 | 19 of 28 |
| #7 Bollinger reversion | 47 | 63.8% | +0.36% | +1.75% | 1.28 | +0.8% | -13.2% | 8.3% | 0.17 | 15 of 28 |
| #8 MACD + EMA + VIX | 108 | 42.6% | +0.34% | -0.55% | 1.25 | +1.7% | -31.2% | 33.2% | 0.23 | 15 of 28 |
| #9 Vol-target trend | 47 | 31.9% | +1.79% | -1.39% | 2.01 | +4.5% | -25.9% | 63.5% | 0.41 | 19 of 28 |
| #10 VIX spike reversal | 13 | 61.5% | +0.73% | +1.08% | 1.46 | +0.5% | -13.2% | 1.7% | 0.13 | 10 of 28 |
| Buy and hold QQQ | – | – | – | – | – | +5.4% | -83.0% | 100% | 0.32 | – |
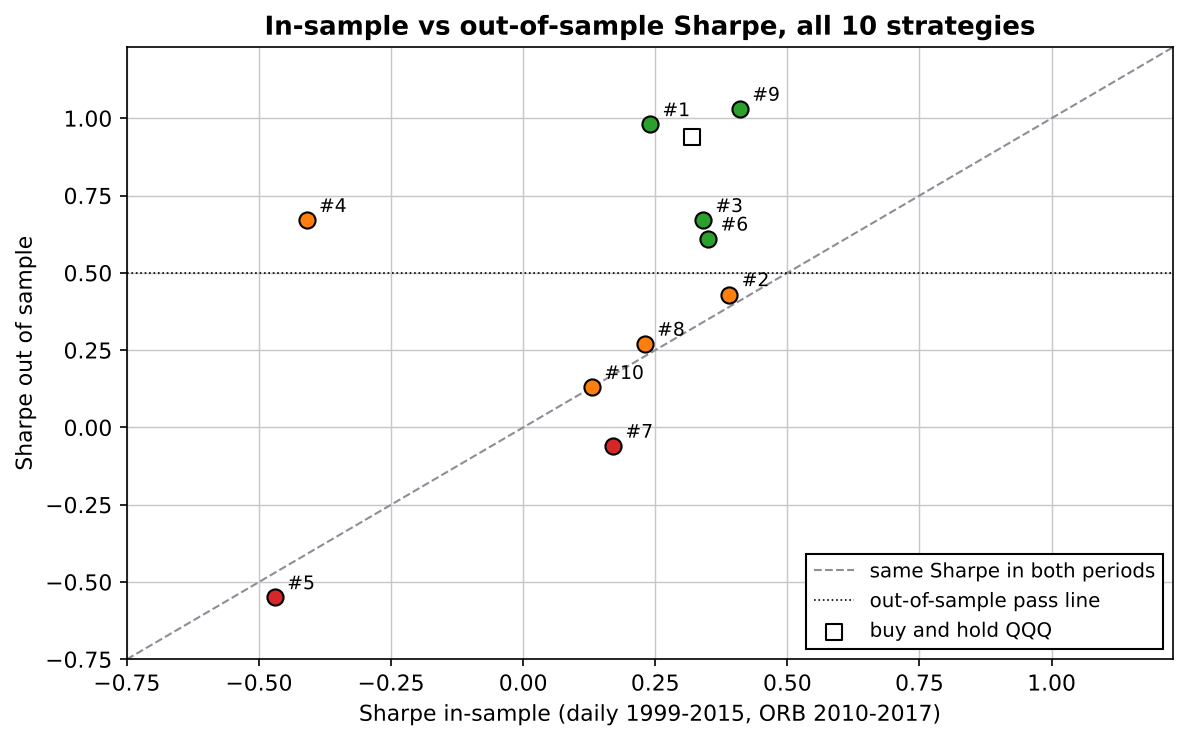
Seven of the ten had a higher Sharpe out of sample, one was level, and the median went from 0.23 to 0.52. Buy and hold did the same thing, from 0.32 to 0.94. That isn't the rules getting smarter after 2015. It is the market: the in-sample years include the 83.0% fall of 2000 to 2002 and 2008, and the out-of-sample years are mostly a long Nasdaq bull market. Look at #1, the 200-day rule: in-sample it won only 16.2% of its trades, had a -58.9% drawdown, and its Sharpe of 0.24 was below buy and hold's 0.32. Out of sample it looks like a star. Same rule, different decade.
The rule I'd take most seriously is #9, because it held up in both halves. In-sample its Sharpe was 0.41 against 0.32 for buy and hold, out of sample 1.03 against 0.94, and in 2000 to 2002 it lost 23.7% while QQQ lost 83.0%. Two caveats. It borrows: on 32.6% of days the weight is above 1×, and I charged no interest on that. At 5% a year on the borrowed part, the out-of-sample Sharpe is 0.99 and the total return falls from 313.5% to 289.0%. And it made less money than holding QQQ: 313.5% against 581.2% out of sample. What it bought was a smoother ride. The year-by-year record shows where each rule earned and lost:
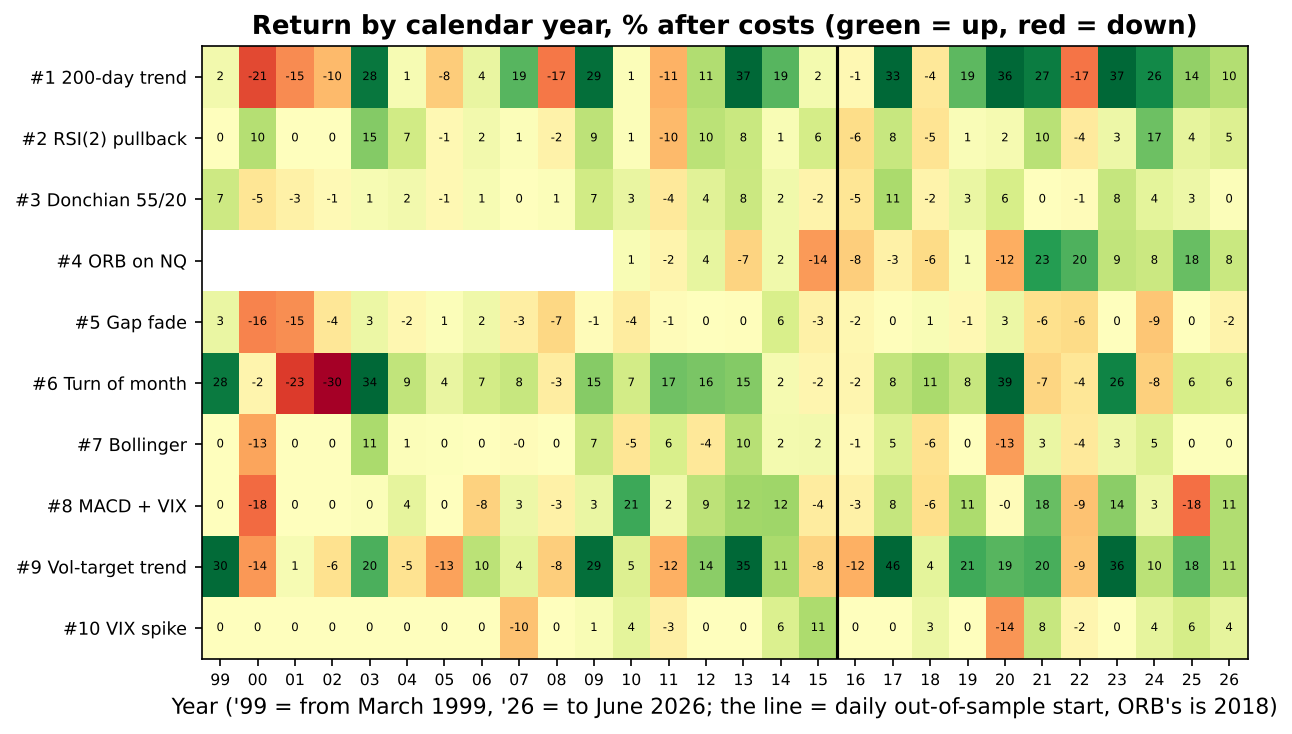
So the trend rules mostly reflect the market they ran in. The day-trading rule is a different case, because its result depends on something you control: what you pay per trade.
The day-trading rule lives or dies on costs
Rule 4, the opening range breakout on NQ futures, traded on 4,043 days, about every day the market opened. In-sample (2010 to 2017) it lost money even before costs: the average trade made -0.35 basis points gross. Out of sample it made +4.13 basis points gross per trade, so at our 0.01% round trip (1 basis point) it kept about three quarters of that. The typical opening range was only 0.4% of price, so the stop is close and costs matter.
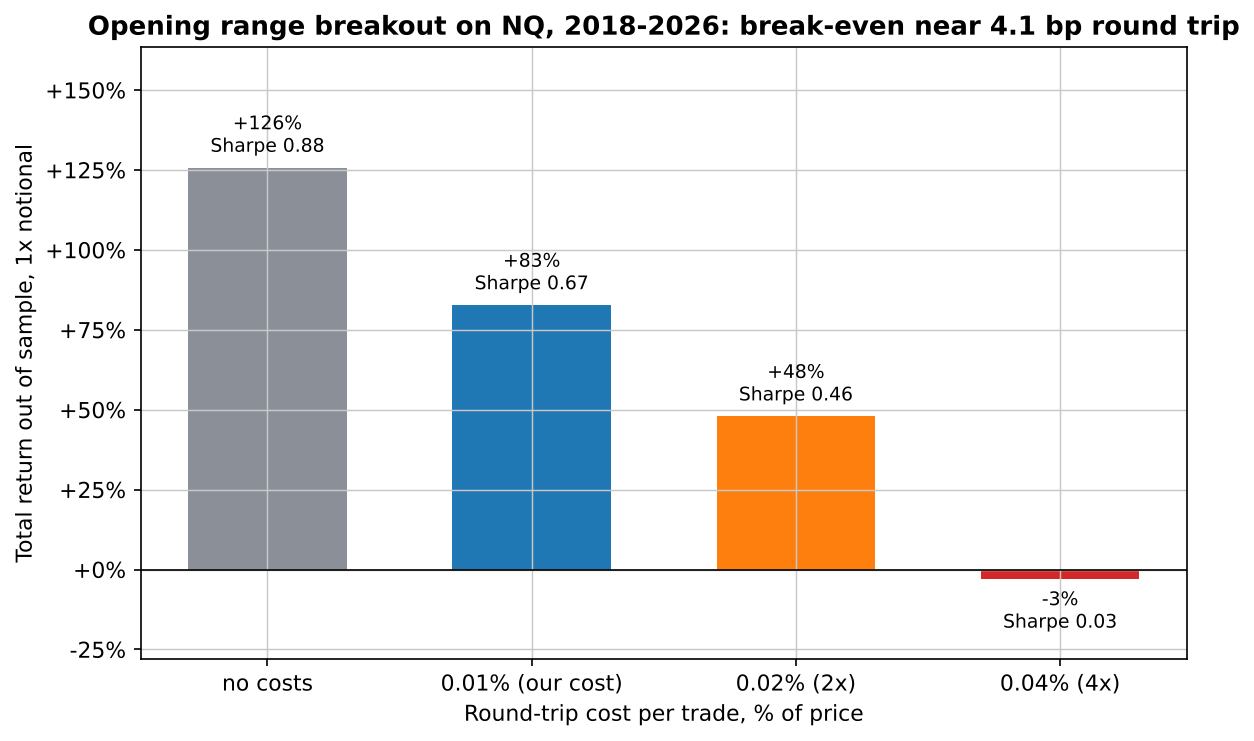
Is 1 basis point realistic? At recent NQ prices it is about two and a half index points per round trip, slippage included, which is achievable for a careful trader and easy to exceed with market orders in a fast open. At 2× costs the Sharpe is 0.46 and the profit factor 1.07; at 4× the total return is -3.1%. Add the in-sample loss and I would call this one weak, which is exactly where the profit factor put it. Next, the two rules that failed, because they fail in an instructive way.
The losers win often and still lose money
The gap fade won 57.2% of its 544 trades and its median trade was +0.32%. It still lost 48.9% over the full period, because the average trade was -0.12%: small wins, larger losses. A gap down of 0.5% to 1.5% in an uptrend often does fill. When it doesn't, the 1 × ATR stop is far away and gets hit, and on a daily chart you can't see whether the stop or the fill came first, so I gave the stop priority. The Bollinger rule shows the same pattern out of sample: a median trade of +1.24% and an average of -0.15%. The VIX spike rule has the highest out-of-sample win rate on the list, 75.0%, on only 24 trades out of sample and 13 in-sample, and a Sharpe of 0.13 in both halves. Filled at QQQ's own close, as the AI wrote it, it would show 0.17, but that version reads a VIX close that doesn't exist yet when QQQ closes, so it is not the one on the scoreboard. A high win rate is the easiest thing for a rule to have and the least useful. Which raises the obvious question: can the weak ones be fixed without curve fitting?
One change, chosen before I looked, rescues the gap fade
Every strategy article on this site now gets the same short menu of standard improvements, fixed on 2026-10-28, two days before this run: a trend filter, a calm-market filter, a "buy only after fear" VIX filter, volatility-scaled size, a fixed time exit, an ATR stop, trading one side only, and skipping Fed days. Each has a published source, and most have three preset settings. The rule for keeping one is strict: using in-sample data only (the data were cut at the end of 2015, or 2017 for NQ, before any variant was computed), it must raise the Sharpe by at least 0.10 at its default setting, and at least 70% of its settings must beat the original. At most two per strategy. Only then do the kept ones see the out-of-sample years, with the same costs and the same pass line.
The table shows every improvement tried: the change in in-sample Sharpe at the default setting, and in brackets how many settings beat the original. A dash means the item does not fit that kind of rule (for example a time exit on rule 9, which has no single entry). Bold ones were kept.
| In-sample only | Original Sharpe | Trend filter | Calm market | After fear (VIX) | Vol-scaled size | Time exit | ATR stop | One side | Skip Fed days |
|---|---|---|---|---|---|---|---|---|---|
| #1 200-day trend | 0.24 | – | +0.01 (2/3) | – | +0.11 (3/3) | -0.07 (1/3) | -0.07 (1/3) | – | – |
| #2 RSI(2) pullback | 0.39 | +0.01 (2/3) | – | -0.06 (1/3) | +0.13 (3/3) | +0.20 (2/3) | +0.02 (1/3) | – | – |
| #3 Donchian 55/20 | 0.34 | -0.19 (1/3) | +0.02 (1/3) | – | -0.07 (0/3) | -0.21 (1/3) | +0.00 (1/3) | – | – |
| #4 ORB on NQ | -0.41 | -0.08 (1/3) | +0.29 (3/3) | – | +0.02 (2/3) | -0.09 (0/3) | +0.00 (0/3) | +0.27 (1/1) | +0.02 (1/1) |
| #5 Gap fade | -0.47 | +0.12 (3/3) | – | +0.23 (3/3) | +0.04 (3/3) | +0.69 (3/3) | +0.00 (0/3) | – | – |
| #6 Turn of the month | 0.36 | -0.11 (0/3) | -0.17 (0/3) | – | +0.01 (2/3) | -0.12 (0/3) | – | – | – |
| #7 Bollinger reversion | 0.17 | -0.11 (0/3) | – | +0.05 (3/3) | +0.14 (3/3) | +0.03 (2/3) | -0.01 (1/3) | – | – |
| #8 MACD + EMA + VIX | 0.23 | – | +0.00 (1/3) | – | -0.03 (1/3) | -0.24 (0/3) | -0.02 (1/3) | – | – |
| #9 Vol-target trend | 0.41 | – | -0.04 (0/3) | – | -0.04 (1/3) | – | – | – | – |
| #10 VIX spike reversal | 0.13 | -0.32 (0/3) | – | +0.00 (0/3) | -0.06 (0/3) | +0.08 (3/3) | -0.24 (0/3) | – | – |
That is 46 improvements and 135 settings tried, and 8 passed. The gap fade's trend filter passed too but came third, so the two-per-strategy limit left it out. Here are the 7 kept ones out of sample, next to the original rule:
| Kept improvement | Sharpe in-sample | Sharpe out of sample | Profit factor OOS | Trades OOS | Max DD OOS | Verdict |
|---|---|---|---|---|---|---|
| #1 200-day trend + volatility-scaled size | 0.24 → 0.35 | 0.98 → 0.79 | 5.90 | 26 | -19.7% | survives → survives |
| #2 RSI(2) pullback + volatility-scaled size | 0.39 → 0.52 | 0.43 → 0.50 | 1.69 | 85 | -18.8% | weak → survives |
| #4 ORB on NQ + calm market only | -0.41 → -0.12 | 0.67 → 1.06 | 1.20 | 1,634 | -9.7% | weak → survives |
| #4 ORB on NQ + one side only (short) | -0.41 → -0.14 | 0.67 → 0.25 | 1.06 | 1,022 | -24.8% | weak → weak |
| #5 Gap fade + 10-day time exit | -0.47 → 0.22 | -0.55 → 0.81 | 1.65 | 134 | -14.9% | fails → survives |
| #5 Gap fade + only after fear (VIX above its 20-day average) | -0.47 → -0.24 | -0.55 → -0.48 | 0.66 | 80 | -12.0% | fails → fails |
| #7 Bollinger reversion + volatility-scaled size | 0.17 → 0.31 | -0.06 → -0.03 | 0.91 | 38 | -22.2% | fails → fails |
Four of the 7 survive, 1 stays weak and 2 still fail. The improvement table compares each improvement with the original rule run on data cut at the in-sample end, which is why turn of the month shows 0.36 there and 0.35 in the in-sample table above: the cut changes its last trade. For the volatility-scaled versions the profit factor is computed on the unsized trades, so only the Sharpe reflects the sizing. The interesting one is the gap fade. As written it fails: -0.55 out of sample. With the fixed 10-day exit, chosen on 1999 to 2015 data only, it made 0.81 out of sample with a profit factor of 1.65. The reason is plain: holding a gap-down in an uptrend for two weeks is a way to buy dips in a rising market, while selling at the same day's close throws that away. But it is now a different strategy, in the market 32.9% of the time instead of 8.4%, and it ran in the same friendly decade as the trend rules. The other two upgrades sit right on the line. The RSI(2) rule with volatility-scaled size reached exactly 0.50. The opening range breakout with the calm-market filter made 1.06, but its profit factor of 1.20 is on the line too, and at 2× costs it drops to 1.16 with a Sharpe of 0.84, which is weak. And one kept improvement made things worse out of sample: volatility scaling cut the 200-day rule from 0.98 to 0.79. Improvements chosen in-sample are a better bet than improvements chosen afterwards, but they are still bets. That brings me to what the AI was actually good for.
AI writes rules fast; it doesn't test them, and that is the job
When AI arrived, I could suddenly code strategies I had traded by hand for years, quickly. Most of them didn't work. Some were a break-even dance, some made money over time with a hit rate nobody could live with, and some were eaten by costs I had never counted. That is why I don't think the interesting part of this test is the AI. Its ten rules were sensible, clearly written, and came with the right warning. This was one model and one prompt, so I can't say what ChatGPT would answer; but the list is the textbook canon, and that is what a chatbot tends to give you, which is better than most forum advice.
What the AI can't do from a prompt is tell you which of its rules work. It doesn't know that the RSI(2) rule wins 68.2% of the time and still misses the bar, or that the day-trading rule breaks even at about 4 basis points, or that the out-of-sample decade it would point you to was unusually kind to anything long the Nasdaq. Those answers come from data, costs and a pass line you set before you look. The pretty backtests circulating online, often built with AI, usually skip exactly those three. If you take one thing from this: treat an AI trading strategy as a hypothesis, save it before you test it, charge real costs, and compare it with simply holding the market. Four of these ten pass that test. Two beat the market on Sharpe. None beat it on total return.
Lab notes
This test was registered on 2026-10-15: the prompt, the split, the costs and the pass line, committed before the question was asked. The question went to a separate, fresh session at 04:42 UTC on October 30, and its answer was saved to a file before any code ran. My first pass at the day-trading rule reported it "in the market" on almost every day, because I counted any day with a trade; the honest number is the share of the session in a position, 51.9% out of sample, and that is what the tables show. Two variants landed exactly on the pass line (the RSI(2) upgrade at a Sharpe of 0.50 and the opening range upgrade at a profit factor of 1.20), so the verdicts are computed from unrounded numbers, not from what the table prints. The futures contract switches in our continuous NQ data (53 of them) were removed before building the daily bars the filters use. The independent review of the first draft caught that rule 10 bought at QQQ's 16:00 close on a VIX close that only settles at 16:15; it now trades at the next open everywhere in this article, and the fix cost it the one improvement it had passed. Finally I ran the standalone strategy.py from the PDF on the same QQQ file: it reproduced every daily rule's total return to the decimal; the only difference was the trend rule's position still open at the end of the data, which the main script counts as a trade.
So, can an AI give you a trading strategy that works? It gave me ten testable ones in a single reply, and four of them held up after costs on data they had never seen. It just couldn't tell me which four.
Get all 10 AI strategy rules + the Python harness (PDF)
Every rule from this test, the prompt we used, the results table, and standalone Python you can run on your own data. Free, by email.
Instant delivery. One PDF, no spam. Unsubscribe anytime.
FAQ
Can ChatGPT or another AI give you a profitable trading strategy?
It can give you testable rules quickly, and they are usually sensible classics. In our test (one model, one prompt) a fresh Claude Sonnet 5.5 session wrote 10 Nasdaq-100 strategies; after costs, 4 cleared our out-of-sample bar (Sharpe of at least 0.5 and profit factor of at least 1.2), 4 were weak and 2 lost money. Only 2 beat buy and hold QQQ on Sharpe from 2016 to 2026, and none beat it on total return. The AI does not test its own rules; that part is your job.
How do you backtest an AI trading strategy?
Save the AI's answer before you test anything, so you can't quietly edit the rules after seeing results. Write down every ambiguous reading. Split the data into an in-sample and an out-of-sample period, charge realistic costs, fill stops at the open when the market gaps through them, and decide the pass line in advance. Then compare the result with simply holding the market over the same years.
Which AI trading strategy did best in the backtest?
The volatility-targeted trend rule: hold up to 1.5 times QQQ, scaled down when volatility rises, and nothing when QQQ is below its 100-day average. Out of sample it made a Sharpe of 1.03 against 0.94 for buy and hold, with a worst drawdown of -14.4% against -35.1%. It still made less money than holding QQQ, 313.5% against 581.2%, and the backtest charged no interest on the borrowed part.
Did the AI's day-trading strategy work?
Barely. The opening range breakout on NQ futures lost money in-sample (2010 to 2017) and made a Sharpe of 0.67 from 2018 to 2026 at 0.01% per round trip, with a profit factor of 1.11, so we rate it weak. It breaks even at about 4.1 basis points per round trip, so at four times our cost level it is flat.

Robin Eriksson
Founder of EdgeLab. Five years of discretionary losses taught me to test everything — now I publish the strategies that survive. About me →
Related: ICT Silver Bullet strategy: what 16 years of Nasdaq futures say about its win rate · Linda Raschke's Holy Grail trading strategy, tested: as written, it almost never trades · Almost all of the Nasdaq's return happens while you sleep. Can you trade it?