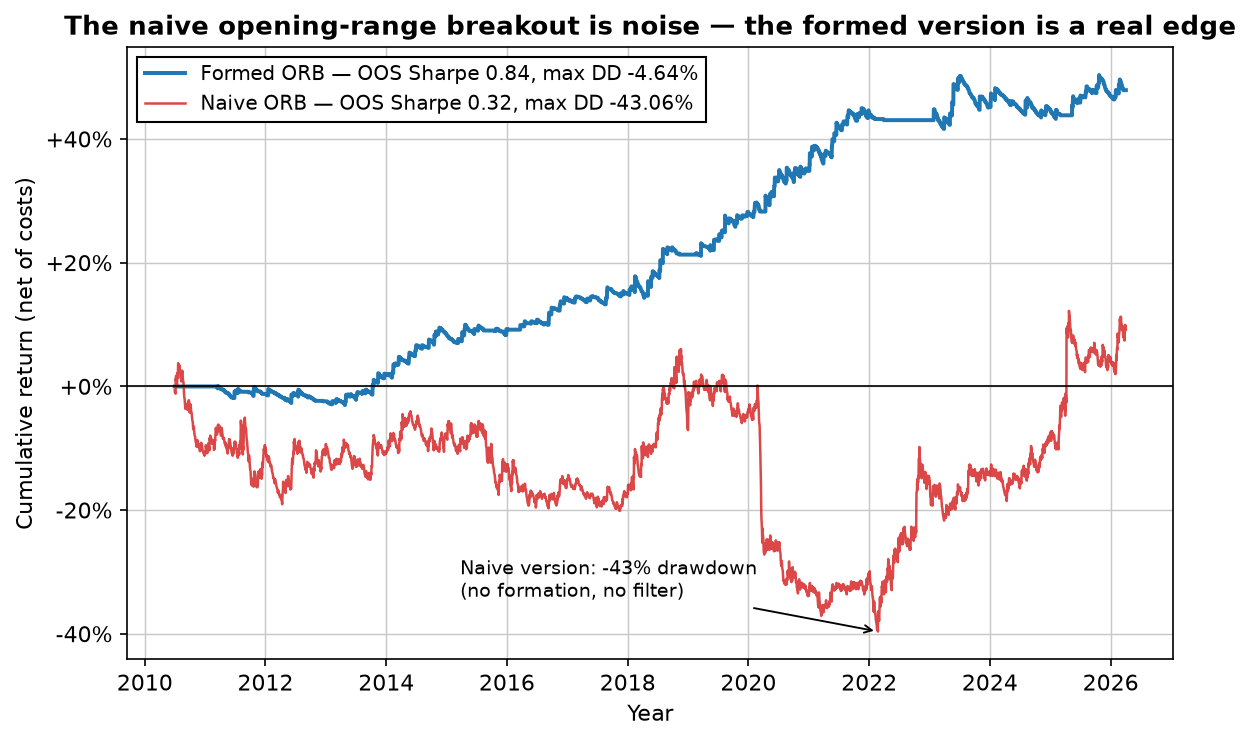
The short version: the naive opening range breakout — form a range, trade the first break either way, no trend filter — is effectively dead on the Nasdaq: a negative in-sample Sharpe of -0.27, a -43% out-of-sample drawdown, and a profit factor of 1.06. The consensus is right about that version. But stop trading the break of the range and instead trade the direction of the opening move — go long only when the first five-minute bar closed up, price is above its 200-day average, with a tight 0.05×ATR stop — and it becomes a real, modest edge: out-of-sample Sharpe 0.84, a -4.6% max drawdown, positive in 7 of 9 years, net of costs. Naive is noise; formed is a strategy. And there's one honest catch — it's been fading for two years.
Why everyone says the opening range breakout is dead
The opening range breakout is one of the oldest intraday ideas there is: mark the high and low of the first few minutes after the open, and trade the direction price breaks out of that range. It's simple, it's teachable, and it has been published to death — which is exactly why the sites that rank #1 for "is ORB dead" conclude that it is. Their reasoning isn't wrong on its face: an edge everyone can see, everyone front-runs, until it's gone.
The problem is what they test. Almost every "ORB is dead" backtest runs the naive version — break of the range, either direction, no filter, often on 24-hour data — finds it doesn't work, and stops there. So we ran that version first, honestly, to see the thing they're describing.
We tested the naive version too — and it's noise
Here's the naive rule set on NQ, the Nasdaq-100 future, on one-minute Databento data from 2010 to 2026: form the opening range over the first 5 minutes (09:30–09:35 ET), take the first close that breaks above the range as a long or below it as a short, stop on the opposite side of the range, exit at the close. No trend filter. Both directions. It behaves exactly like the consensus says:
- In-sample Sharpe: -0.27. Negative — before any out-of-sample test, on the data you'd use to build the thing, it doesn't make money.
- Out-of-sample it drew down 43% for a profit factor of 1.06 — statistically indistinguishable from paying costs to flip a coin.
That negative in-sample number matters more than it looks, and we'll come back to it. A strategy that only makes money out-of-sample — never in-sample — isn't an edge that survived; it's a coin that happened to land heads on the second half of the data. That pattern is the single clearest red flag we know. The naive ORB has it.
The fix: trade the opening move, not the breakout
Keep the 5-minute opening range window, but change what you do with it. The version that survives makes three changes — and the first is conceptual, not a filter:
- Trade the opening move's direction, not a break of the range. If the first five-minute bar closes higher than it opened, the opening move is up — you buy at the next bar's open. You never wait for price to take out the range high; you're already long in the direction it just went. Near-flat "doji" opens are skipped, and there are no shorts — on the Nasdaq the short side loses money out-of-sample.
- Only with the trend. Take the long only when the daily close is above its 200-day moving average. This single filter is what keeps the strategy out of bear markets — and, as you'll see, mostly idle through 2022.
- Risk a fixed, tight amount. Stop at entry minus 0.05 × the 14-day ATR — deliberately tight — and exit at 15:55, one trade a day. You lose small and often; you let the rare clean day run to the close.
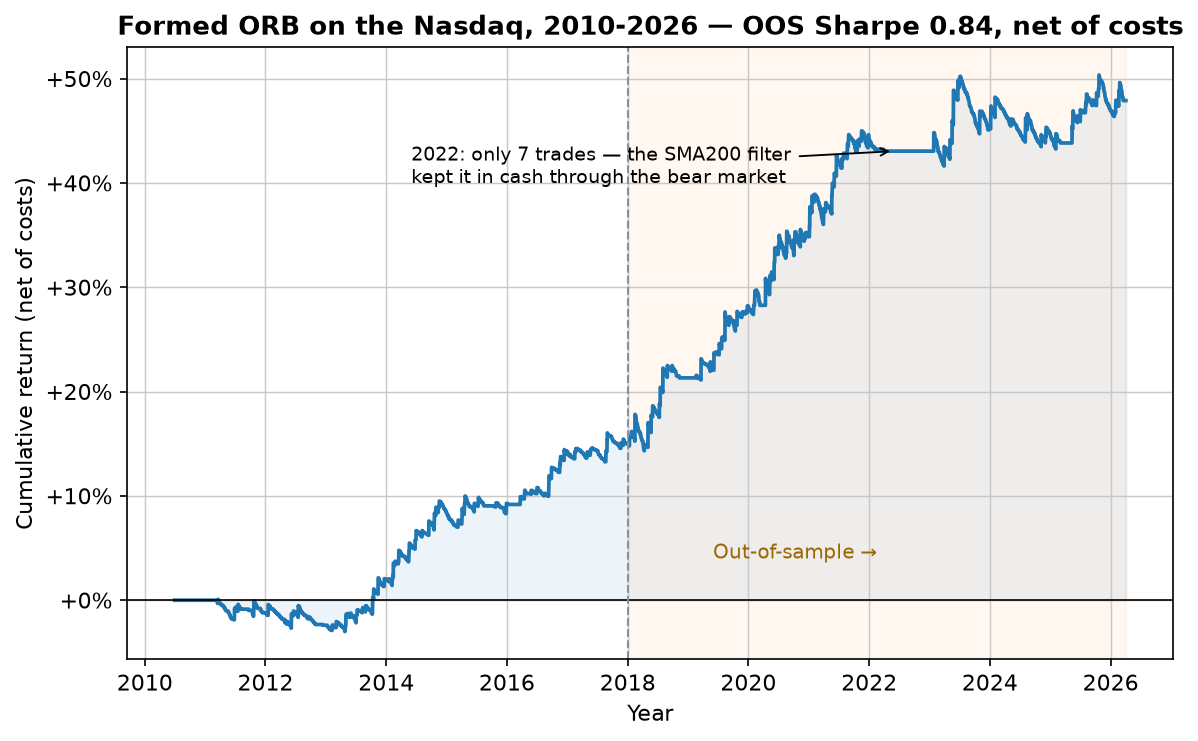
That's the entire strategy. The opening range is still the raw material — but you trade the move it already made, in the direction of the trend, with a hard cap on risk. Here's what that does on the same sixteen years:
The tell: it works in-sample too
The single most important chart in this article isn't the equity curve — it's this one. It's the difference between a real edge and a lucky one.
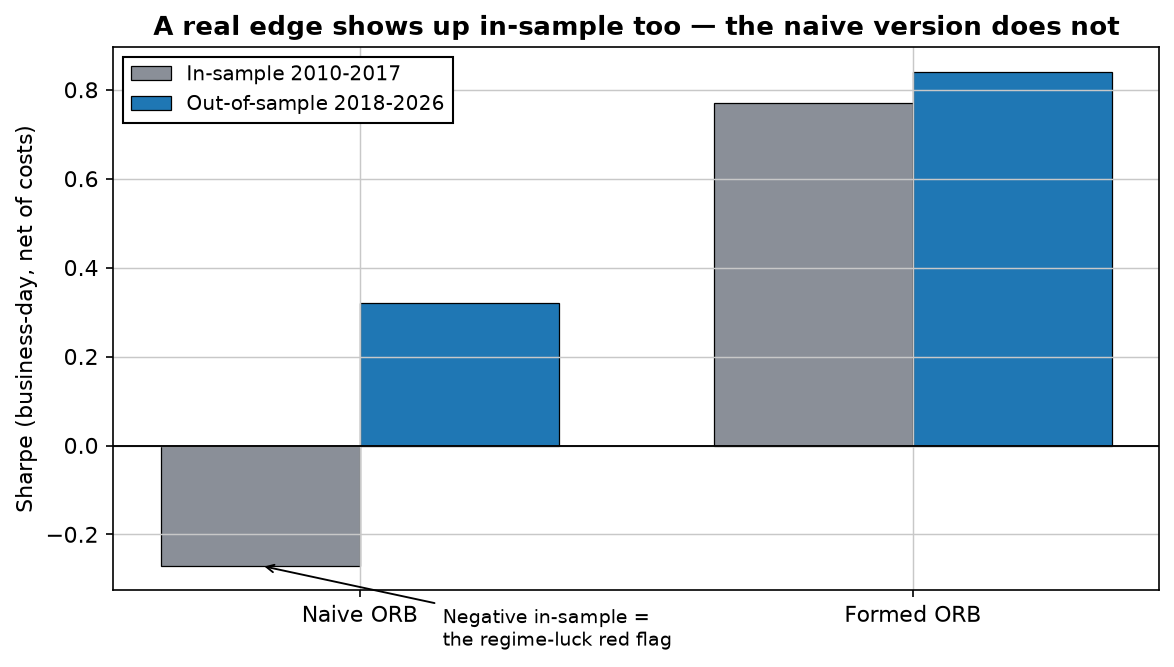
The formed strategy earns a Sharpe of 0.77 in-sample (2010–2017) and 0.84 out-of-sample (2018–2026) — net of costs, and it goes up on unseen data rather than falling apart. A tight-stop, trend-filtered opening-move trade isn't a story we curve-fit: the edge holds across a plateau of stop widths from roughly 0.025 to 0.10 × ATR rather than living at one magic setting, and dropping the single best year still leaves it clearly positive. It behaves like something structural — the first clean thrust off the open, in the direction of the larger trend — rather than a parameter that happened to line up.
One honest note on that 0.84, because you'll see this strategy quoted higher elsewhere. If you measure Sharpe only across the ~100 days a year it actually trades, the out-of-sample number is 1.35. We report the more conservative 0.84, which counts every business day — including the many the strategy sits in cash — because that's the number that shows up when you put it in a portfolio next to everything else. Same trades, honest denominator. We'd rather quote the smaller one.
| Metric (net of costs) | Naive ORB · OOS | Formed ORB · in-sample | Formed ORB · OOS |
|---|---|---|---|
| Sharpe (business-day) | 0.32 | 0.77 | 0.84 |
| Max drawdown | -43.1% | -3.1% | -4.6% |
| Profit factor | 1.06 | 1.37 | 1.41 |
| Win rate | 32.4% | 12.7% | 12.2% |
| Trades | 2,128 | 644 | 828 |
| CAGR (unlevered) | 3.4% | 2.1% | 3.1% |
Read that win-rate row like a skeptic. The formed version wins only 12% of the time — the tight stop means many tiny losers and a few big winners that pay for all of them. That's psychologically brutal to trade live; six or eight losers in a row is normal. And the raw return is small, because this is an unlevered, in-cash-most-of-the-time intraday sleeve. Its value was never headline CAGR — it's a low-drawdown, low-correlation return stream, the kind that earns its place in a portfolio of uncorrelated edges rather than as a standalone system.
Year by year — and where it's fading
Out-of-sample honesty means showing the bad years too, not just the average:
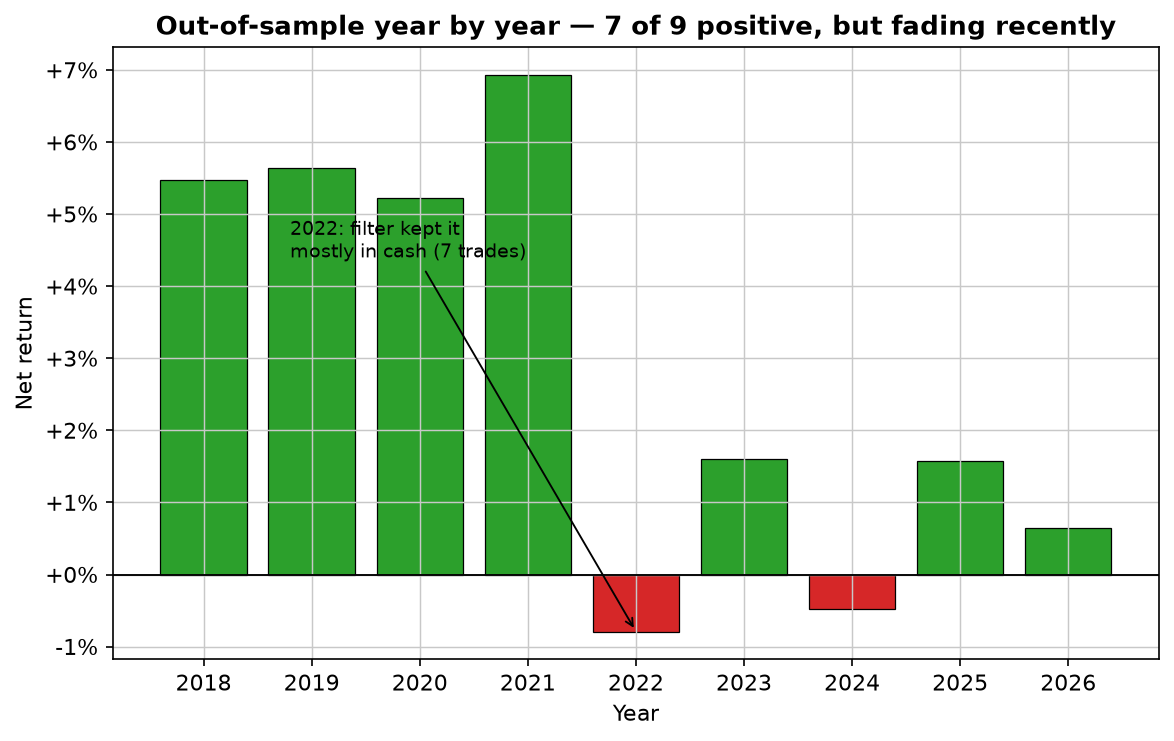
2022 is the interesting bar: almost nothing, because the 200-day filter held it out of the bear market — correct behaviour, but it means this is not free diversification during a crash; it's simply idle. And 2023–2026 are visibly smaller than 2018–2021. We wouldn't publish this as "it works, full stop." We'd publish it as: a real, structural, long-only edge with a tiny drawdown, currently in a weaker regime, worth watching rather than sizing up.
Lab notes
The moment that decided this write-up was the naive version's in-sample Sharpe coming back negative — I'd half-expected it to look fine in-sample and only crumble out-of-sample. Seeing -0.27 on the build data was cleaner than that: there was never an edge to arbitrage away, just a shape that occasionally paid. The whole difference is trading the direction of the opening move, filtered by the 200-day trend, with a tight ATR stop — reproduced here from 1.56 million one-minute bars. The 12% win rate surprised me every time I re-ran it — you stare at a wall of small red losers and have to trust the arithmetic that the green ones are bigger.
Download the free strategy report
Simple and robust — 70% winners across 155 trades over 16 years, net of costs. The free PDF gives you the market, the timeframe and the exact rules in plain English, plus every single trade it has taken.
Instant delivery. One PDF, no spam. Unsubscribe anytime.
FAQ
What is the success rate of the opening range breakout strategy?
Low, by design. The formed 5-minute ORB on Nasdaq futures wins only 12.4% of its trades over 2010–2026 (12.2% out-of-sample), but the winners are big enough for a profit factor of 1.39 and an out-of-sample Sharpe of 0.84, net of costs. The naive version wins more often — 29.5% in-sample — and still loses money. Judge an ORB by its expectancy, not its hit rate.
Is the opening range breakout dead?
The naive version largely is. On 16 years of Nasdaq futures data, a plain break-both-ways ORB with no trend filter had a negative in-sample Sharpe (-0.27) and a -43% out-of-sample drawdown for a profit factor barely above one. But a formed version — a 5-minute range, long-only, a tight 0.05×ATR stop and a 200-day trend filter — earned an out-of-sample Sharpe of 0.84 with a -4.6% max drawdown, positive in 7 of 9 years. The popular version is dead; a disciplined one is not.
What opening range length works best on the Nasdaq?
We tested 5-, 15- and 30-minute ranges on NQ. The 5-minute opening range was clearly strongest both in and out of sample; the 15- and 30-minute ranges were weak in-sample. A shorter range catches the initial thrust before it fades; a longer one dilutes the signal into the mid-morning chop.
Should I use regular-hours or 24-hour data for an ORB backtest?
Regular trading hours — 09:30 to 16:00 ET. The opening range only means anything relative to the cash-session open, when volume and information arrive. Running the range on 24-hour Globex data blurs it with overnight noise, and is one of the quiet reasons many ORB backtests look like they have no edge.
Does the opening range breakout work on stocks or only futures?
We tested it on Nasdaq-100 futures (NQ). In earlier EdgeLab tests the same long-side idea also showed up on S&P 500 futures, at a lower Sharpe, so it travels. But it's an intraday, cost-sensitive strategy — instrument liquidity and your real per-trade costs matter far more than which ticker you pick, and the long side is much more robust than the short side, which loses money out-of-sample on the Nasdaq.

Robin Eriksson
Founder of EdgeLab. Five years of discretionary losses taught me to test everything — now I publish the strategies that survive. About me →
Related: Zarattini's intraday momentum on the Nasdaq: the long side survives, the short side is a mirage · ICT Silver Bullet strategy: what 16 years of Nasdaq futures say about its win rate · Does Connors' RSI(2) still work? We tested it on the Nasdaq