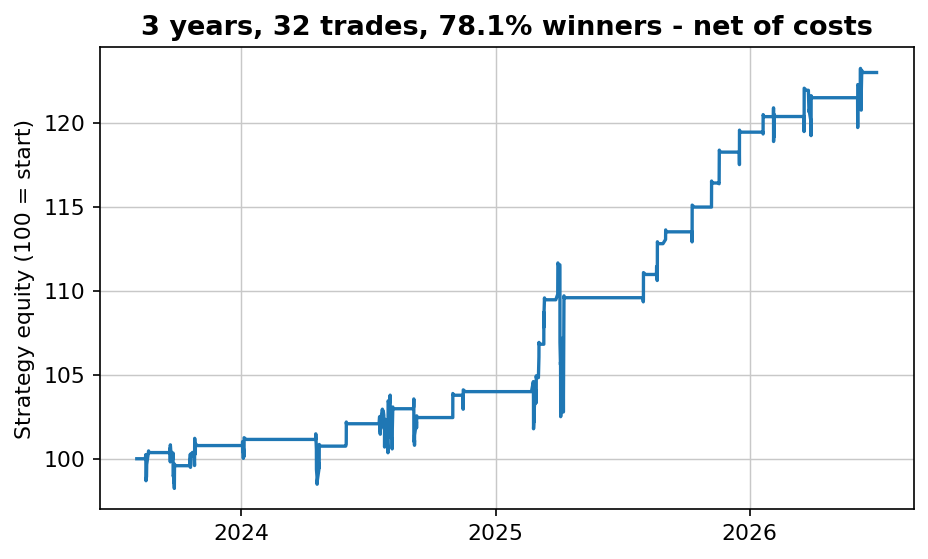
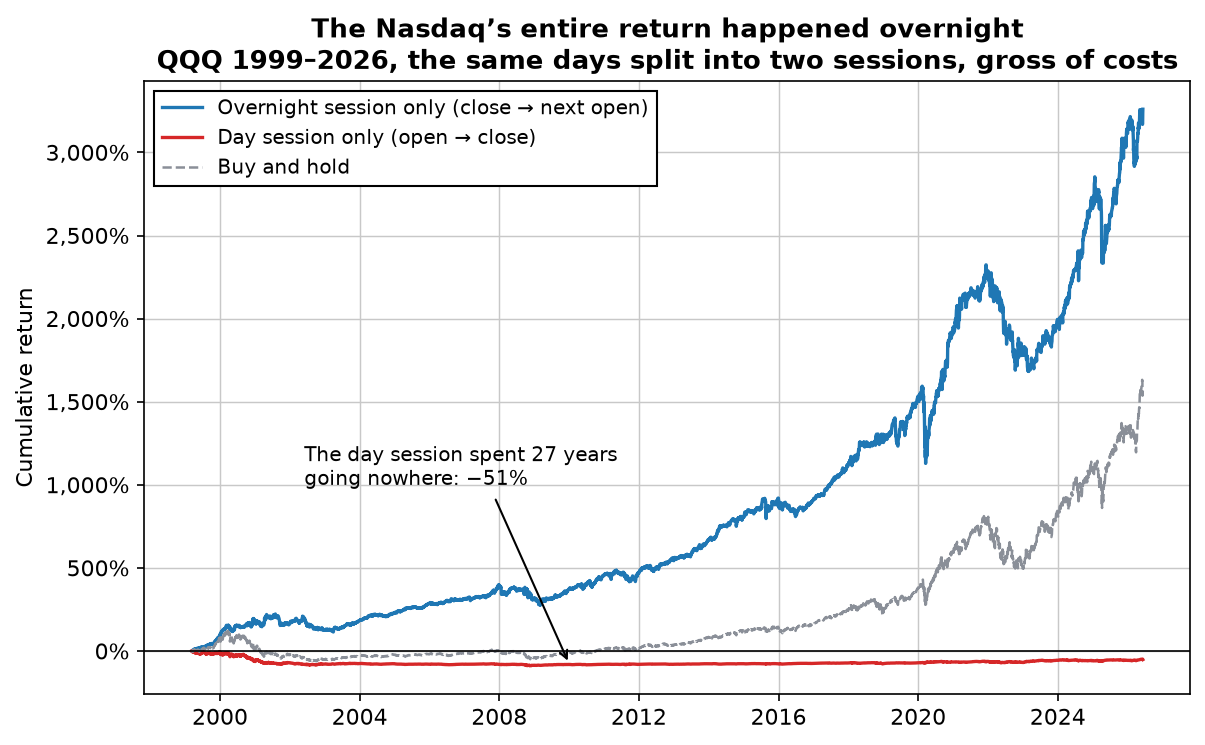
The short version: since March 1999, QQQ's overnight session compounded to +3,260% while the day session lost 51% — buy and hold, +1,543%, is exactly the product of the two. It holds out-of-sample and it holds on SPY. But you cannot harvest it by trading it: the average night pays 5.5 basis points and a round trip has to cost under 2.8bp per side to break even, so at our standard 0.05% per side the same edge turns into -96.5% over 27 years. The version that survives is selective. Buy the close only after three consecutive down closes and sell the next close, and you get 584 trades, 56.7% winners, +0.35% net per trade, a -18.7% max drawdown and 8.5% time in the market — out-of-sample Sharpe 0.67 against 0.73 in-sample. Those rules are written out in full further down, with every number net of costs — the improved version is the point of this article, not a teaser. Two honest catches: the most spectacular part of the headline stopped being true in 2013, and the entry has to be decided in the last minutes before the close — on a small spot check, deciding half an hour earlier kept less than a third of the edge per trade.
The market's return arrives while the exchange is closed
The split is mechanical. Every trading day has two returns in it: the gap from yesterday's close to today's open, and the move from today's open to today's close. Compound each separately and you have two equity curves whose product is buy and hold, exactly. That is worth stating precisely, because it is what makes the result impossible to wave away as a data artefact: on our cache the reconstruction error is 0.000000. Nothing is being double counted.
Over 27 years on QQQ, the overnight half returned +3,260% at a Sharpe ratio of 0.98. The day half returned -51% at a Sharpe of 0.00. Notice how strange that second pair is: the average day session earns 0.01 basis points — a rounding error away from exactly zero — and still compounds to a 51% loss, because volatility drag turns a zero average into a negative outcome. The day session has not been a losing bet so much as a coin flip you paid to take, 6,854 times.
Two checks before anyone gets excited. First, out-of-sample: splitting the history in half, the overnight session earned a Sharpe of 0.95 in 1999–2012 and 1.03 in 2013–2026. It did not decay. Second, another market: on SPY back to 1993, the overnight session returned +2,238% against +30% for the day session. This is not a QQQ quirk, and it is not a recent fad.
Which raises the obvious idea, the one that gets posted alongside every version of this chart: just buy the close and sell the open. Own the good half, skip the bad one. That is where it falls apart.
Trading the night every night loses 96% of your money
Owning only the overnight session means a round trip every single day — 251.5 of them a year. And the thing you are buying with all that trading is thin: the average overnight session on QQQ is worth 5.53 basis points. Half of that, 2.8bp, is what a single side of the trade is allowed to cost before the whole edge is gone.
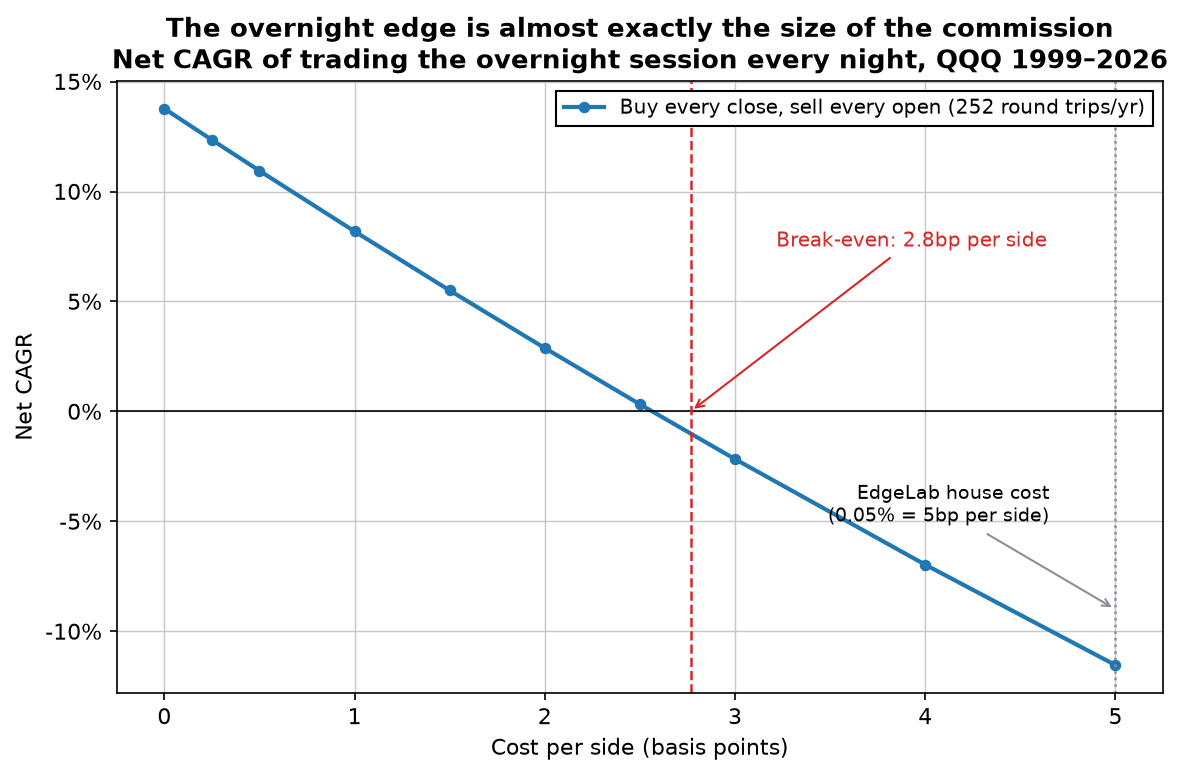
Run it at the house cost and the headline inverts completely: +3,260% gross becomes -96.5% net, a -11.5% annual return with a -98% drawdown. That is the number the viral version of this chart never shows.
Be fair about the other direction, though. Our 0.05% per side is deliberately punitive — it is the cost we charge every equity strategy so that nothing squeaks through on optimistic assumptions. A retail trader in a liquid ETF like QQQ, paying a one-cent spread on a $708 share with zero commission, is closer to 1bp per side, and at 1bp the overnight strategy earns 8.2% a year gross of taxes. So the honest statement is not "it cannot be done." It is: your entire edge is the spread, you are betting a five-basis-point average against your own execution quality 252 times a year, and a single bad fill a week erases the year. That is not an edge we would build a strategy on.
Which leaves the more interesting question. If the average night is too thin to pay for a round trip, are all nights average?
The day session is dead on average, not in general
They are not. Sort every session in the sample by how the previous day closed — specifically, by how many consecutive down closes came before it — and the two sessions behave completely differently depending on what preceded them.
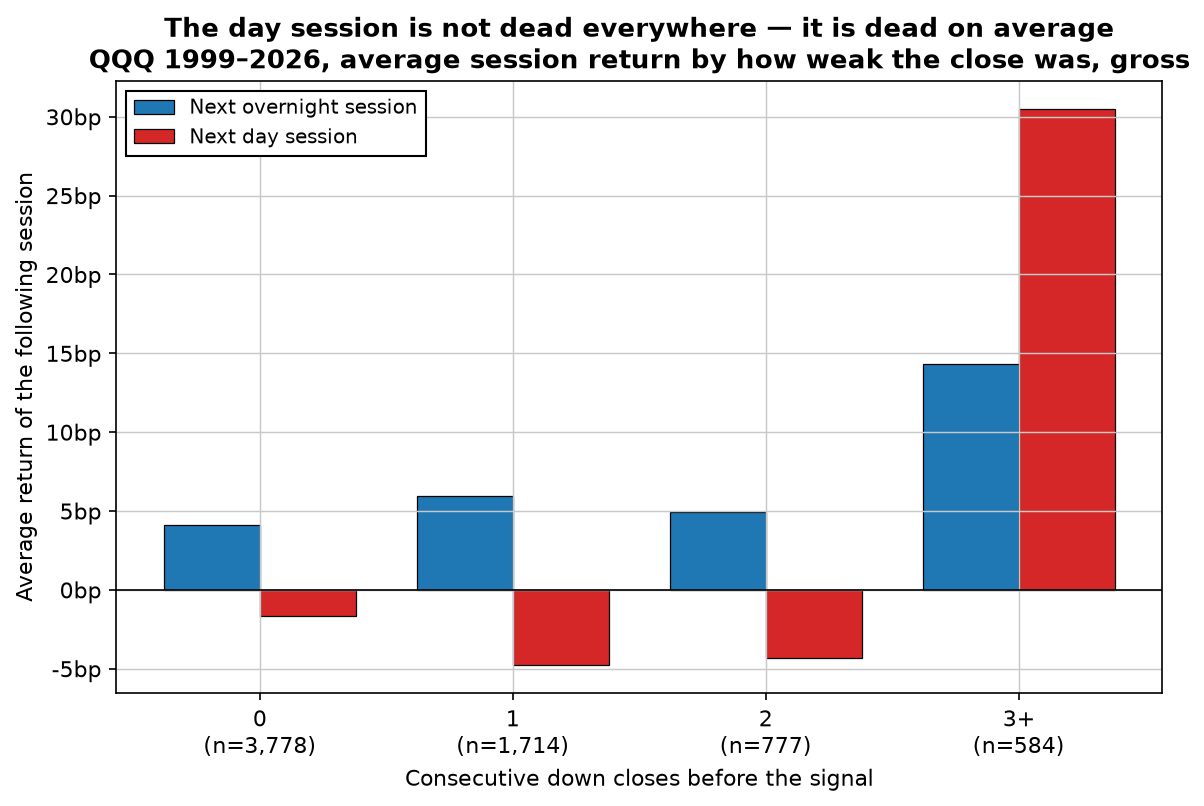
After an up close, the next night averaged +4.1bp and the next day -1.6bp — the textbook overnight effect, too small to trade. After three consecutive down closes, the next night averaged +14.3bp and the next day +30.5bp. The day session, which loses money in every other column of that chart, becomes the bigger half of the payoff.
That is the real finding in this article, and it is the opposite of the lesson people take from the overnight charts. The day session is not structurally dead. It is dead on average — and the average is hiding a small number of sessions, after the market has closed weak several days running, where being awake pays more than being asleep. Put those two halves together and you have something with enough edge per trade to survive a commission.
The rules, and what they produced
Buying after a run of down closes is not our idea — Larry Connors and Cesar Alvarez published variants of the "down N days" pattern years ago, and it is one of the oldest ideas in short-term mean reversion. What we are adding is the session logic: where in the day that edge actually lives, and therefore when you have to be in the position to collect it.
The rules, in full:
- Signal: QQQ closes down three days in a row (each close below the one before).
- Entry: buy at that third close. In practice the signal has to be judged in the final minutes of the session — the first caveat below measures what that costs.
- Exit: sell at the next close. One full session — the night and the following day.
- No stops, no targets, no filters. Every fill is a market order at a closing price, so nothing in this strategy can be gapped through.
That last point is not a stylistic choice. A stop or a limit that price has already passed by the time the session opens is the single most common way a backtest invents returns that were never available — it is how we have killed strategies here before. A close-to-close strategy has nothing to gap through, which makes it unusually honest to test — with one catch on the entry side, which we measure further down rather than assume away.
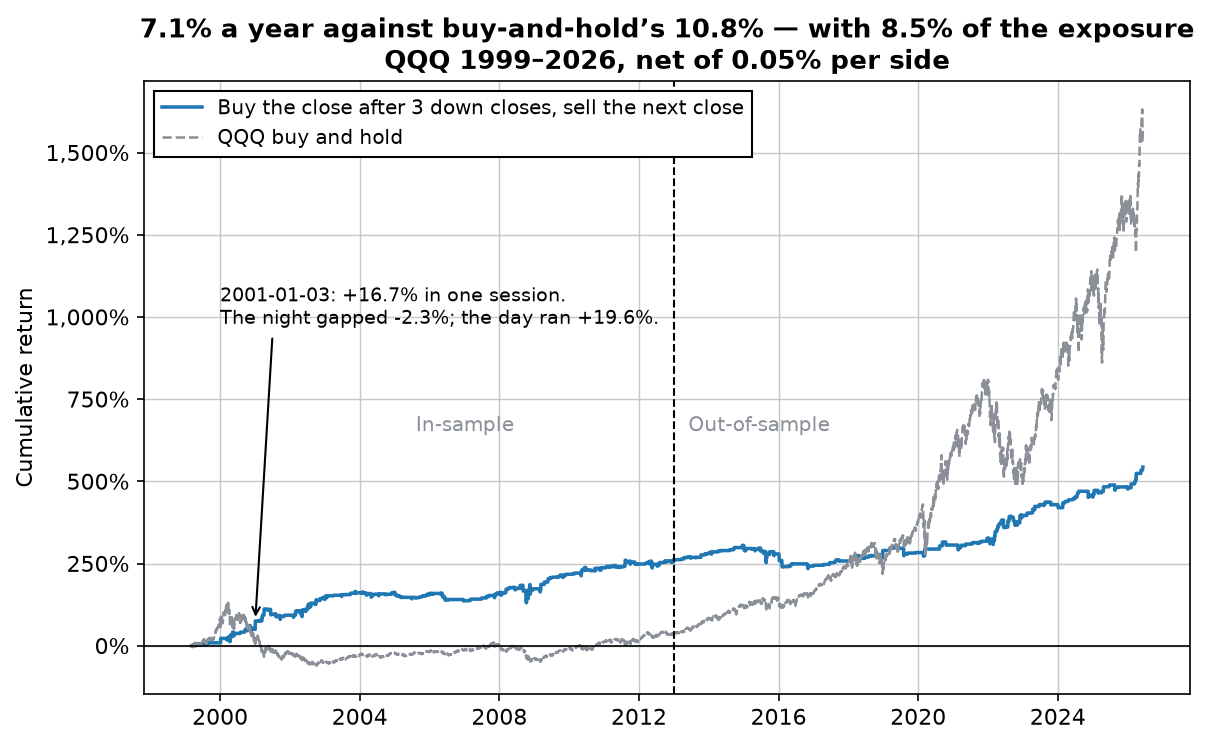
| Metric (net of 0.05%/side) | In-sample 1999–2012 | Out-of-sample 2013–2026 | Full sample |
|---|---|---|---|
| Trades | 342 | 242 | 584 |
| Trades per year | 24.8 | 18.0 | 21.4 |
| Win rate | 55.8% | 57.9% | 56.7% |
| Average net per trade | +0.41% | +0.25% | +0.35% |
| Sharpe (daily, flat days count as zero) | 0.73 | 0.67 | 0.67 |
| Max drawdown | -18.7% | -17.5% | -18.7% |
| CAGR | 9.8% | 4.4% | 7.1% |
| Time in market | 9.8% | 7.2% | 8.5% |
Read the last two rows together, because that is the whole case for a strategy like this. It earned 7.1% a year against buy-and-hold's 10.8% — clearly worse — while being exposed to the market 8.5% of the time and taking a -18.7% worst drawdown against buy-and-hold's -83%. Two thirds of the annual return for a twelfth of the exposure and under a quarter of the drawdown. That is not a system to put your whole account in; it is a sleeve that leaves room for others, which is the only reason we build strategies with this shape.
The out-of-sample column is the one that matters, and it is honest about the direction of travel: the edge is smaller than it was (0.25% per trade against 0.41%) but the shape survived completely intact — same win rate, same drawdown, Sharpe 0.67 against 0.73. Now, how much of that depends on the article's premise being true?
Entering at the close is worth 14 basis points a trade
Here is the test that ties the strategy back to the overnight finding. Take the identical signal and change only when you are in the market:
| Same signal, three ways to hold it | Net per trade | Win rate | Sharpe | Cumulative |
|---|---|---|---|---|
| Buy the close, sell the next close (owns the night) | +0.35% | 56.7% | 0.67 | +543% |
| Buy the next open, sell the next close (skips the night) | +0.20% | 52.6% | 0.45 | +191% |
| Buy the close, sell the next open (the night alone) | +0.04% | 55.7% | 0.16 | +23% |
Waiting for the open — which is what every trader who "does not like holding overnight" does — costs 14 basis points per trade and takes the Sharpe ratio from 0.67 to 0.45. And the night by itself, the thing the viral chart tells you to buy, is worth almost nothing after costs: 4 basis points a trade. Neither session is the strategy. The edge lives in the seam between them, and you have to be positioned before the close to collect it.
The same logic runs in reverse, and it is the most portable thing in this article: if your system exits at the close, you are systematically skipping the half of the day that pays. That is worth checking on whatever you currently trade — it is a one-line change to a backtest and it is free to measure.
It earns its keep in the years buy-and-hold does not
The year-by-year record is where this strategy stops looking like a weaker QQQ and starts looking like a different asset.
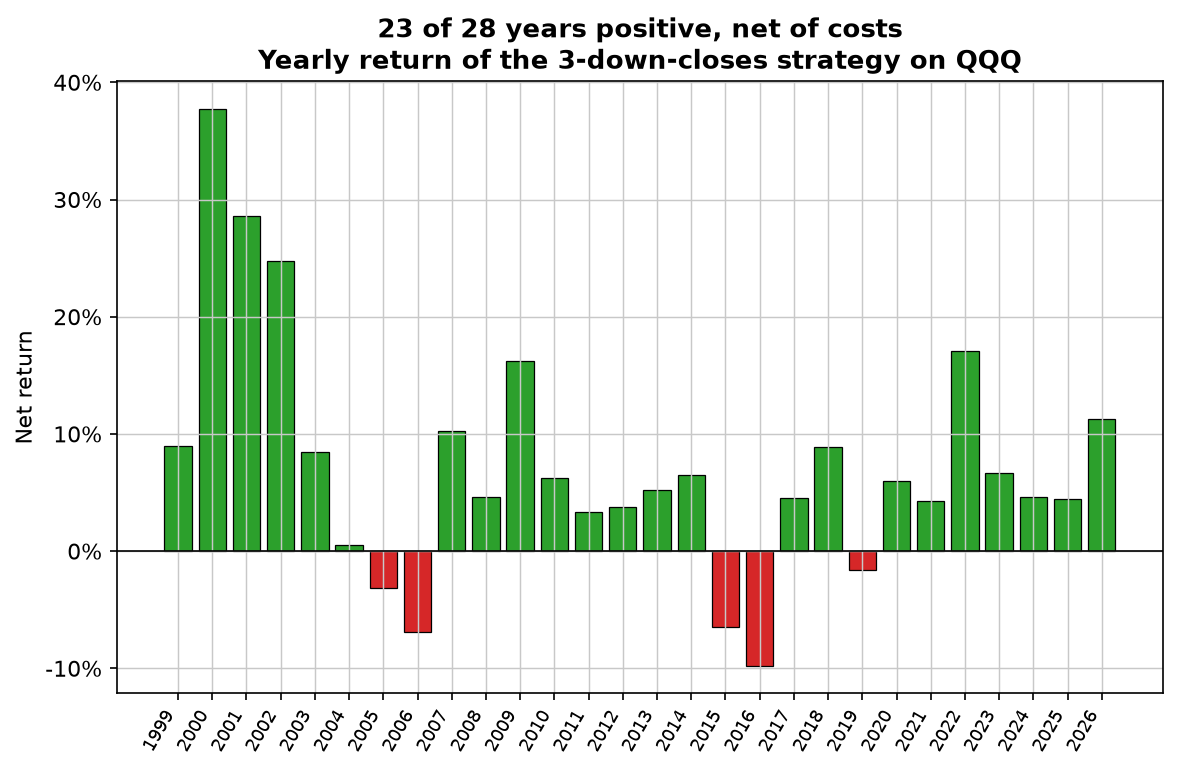
In 2000 the strategy returned +37.7% while QQQ fell 36.1%. In 2001, +28.6% against -33.3%. In 2002, +24.8% against -37.4%. In 2022, +17.1% against -32.6%. The mechanism is not mysterious: three down closes in a row are common in a falling, volatile market and rare in a calm rising one, so the strategy trades most when everyone else is losing money and sits in cash through the melt-ups.
Which is also its weakness, stated plainly: in 2019 it made -1.6% while QQQ made 39%, and 2015, 2016 and 2019 are three losing years inside one long bull market. If you hold this on its own you will spend entire years watching an index run away from you. Its value is in the correlation, not the return — which is exactly the property that makes a strategy worth owning next to others rather than instead of them.
Where this could still fail you
Four caveats, in the order we would worry about them.
1. Getting the close is harder than the backtest admits. The entry needs a decision at the end of the session, and a market-on-close order has to be submitted before the exchange's cut-off — so you cannot wait for the official print and then trade it. We measured the cost of deciding early using hourly data, which only goes back to August 2023 in our cache, so treat this as a spot check rather than a result: over those 714 days, the sign of the day agreed at 15:30 ET with the final close 79% of the time, and when the market was down at 15:30 it still closed down 97.5% of the time. The signal itself is reliable. Deciding half an hour early costs you twice, though. You lose trades: only 24 of the 46 signals in that window had already formed at 15:30, because the rest sold off into the close. And you lose edge: the trades you could have taken at 15:30 averaged +0.13% net, against +0.43% for the close entry over the same window. Twenty-five trades is far too few to put a reliable number on that gap, but the direction is not ambiguous — the last half hour is where a good part of this strategy lives. In practice that means judging the signal in the final minutes before the closing auction and accepting some slippage against the official print, which is part of what our deliberately high 0.05% per side is there to absorb. If you cannot act in that window, at the screen or through an automated order, this is not your strategy.
2. The headline's best half is a crisis-era artefact. Out-of-sample, the day session's Sharpe was +0.46, not the -0.26 it printed in-sample. "The day session destroys wealth" is a 1999–2012 statement, built on the dot-com bust and the financial crisis. The overnight tilt persisted — the day session's decline did not.
3. It is weaker outside the Nasdaq. The same rules on SPY since 1993: 708 trades, 57.3% winners, +0.16% net per trade and a Sharpe of 0.46, with a nearly identical -18.3% drawdown. It travels, and it is remarkably stable across halves there (0.46 in-sample, 0.47 out-of-sample), but at half the edge per trade. The Nasdaq's extra volatility is doing real work.
4. We looked at more than one threshold. Honest disclosure: three down closes was picked after testing two, three, four and five, against two exits. Every close-to-close variant was positive (two down closes: +0.10% per trade; four: +0.34%; five: +1.12% on only 95 trades), and every exit-at-the-open variant was weak (between -0.01% and +0.25%). That pattern — the exit mattering far more than the threshold — is what makes us treat this as structural rather than fitted. But four and five down closes have noticeably weaker out-of-sample halves, and with 95 trades the five-day version is not something we would size. Costs behave the same way: at double our house cost the strategy still earns +0.25% per trade, at triple, +0.15%.
The last twelve trades, unedited
Study row 2 first. The night went 1.45% against the position and the day session took it all back and a little more, for a net result of roughly zero. That is the strategy in one row: two separate bets stapled together, and the reason you hold through both instead of picking one.
| # | Signal (buy at close) | Exit (next close) | Night | Day | Net |
|---|---|---|---|---|---|
| 1 | 2025-09-25 | 2025-09-26 | +0.14% | +0.27% | +0.31% |
| 2 | 2025-11-13 | 2025-11-14 | -1.45% | +1.55% | -0.02% |
| 3 | 2025-12-15 | 2025-12-16 | -0.37% | +0.57% | +0.10% |
| 4 | 2025-12-30 | 2025-12-31 | +0.04% | -0.86% | -0.93% |
| 5 | 2025-12-31 | 2026-01-02 | +0.94% | -1.12% | -0.29% |
| 6 | 2026-01-02 | 2026-01-05 | +1.01% | -0.21% | +0.69% |
| 7 | 2026-02-05 | 2026-02-06 | +0.53% | +1.58% | +2.01% |
| 8 | 2026-03-13 | 2026-03-16 | +1.06% | +0.06% | +1.02% |
| 9 | 2026-03-20 | 2026-03-23 | +1.58% | -0.43% | +1.05% |
| 10 | 2026-03-30 | 2026-03-31 | +1.08% | +2.28% | +3.28% |
| 11 | 2026-05-19 | 2026-05-20 | +0.54% | +1.11% | +1.55% |
| 12 | 2026-06-05 | 2026-06-08 | +1.81% | -0.24% | +1.46% |
Rows 4, 5 and 6 are the other thing worth noticing: three signals in three consecutive sessions over the turn of the year, the first two both losing and the third winning back a little over half of it. Clusters like that are normal — the signal fires again while you are still bleeding from the last one — and they are why the per-trade average matters more than any individual result.
Lab notes
The first thing I did was check the identity — compound the night series, compound the day series, multiply, and see whether it equals buy and hold. It printed 0.000000 on the first run, which is the only reason I trusted the -51% at all; a split like that is usually a sign that somebody has mislabelled a column. The result that actually changed the article came later and was not welcome: when I tested whether you can really get the closing price, the hourly data said only 24 of 46 recent signals existed at 15:30 ET. Half the trades form in the final half hour. I had written "one decision a day, at the close" in the draft and had to go back and rewrite it as what it is — a decision in the last minutes, with a real cost attached. The trade that made me laugh was January 3, 2001: three down closes, the position already on, and then the night gapped down 2.3% before the Fed's surprise cut sent the day session up 19.6%. The best single trade in 27 years started by going against the position overnight.
Download a free strategy
Simple and robust — 70% winners across 155 trades over 16 years, net of costs. The free PDF gives you the market, the timeframe and the exact rules in plain English, plus every single trade it has taken.
Instant delivery. One PDF, no spam. Unsubscribe anytime.
FAQ
Do stocks really go up overnight?
On the Nasdaq-100 ETF QQQ, yes, and by a wide margin. Splitting every trading day since March 1999 into the overnight session (close to next open) and the day session (open to close), the overnight half compounded to +3,260% while the day half lost 51%. Buy and hold returned +1,543%, which is exactly the product of the two. The same pattern holds on SPY since 1993: +2,238% overnight against +30% intraday. It is not a Nasdaq quirk and it did not stop after 2013 — the overnight session's Sharpe ratio was 0.95 in the first half of the sample and 1.03 in the second.
Can you make money buying at the close and selling at the open?
Not by doing it every night. The average overnight session on QQQ pays 5.5 basis points, so a round trip has to cost less than 2.8 basis points per side to break even. That is thinner than most retail all-in costs once spread and slippage are counted, and at EdgeLab's standard 0.05% per side the same +3,260% gross becomes -96.5% net over 27 years. The overnight edge is real; it is just almost exactly the size of the transaction cost.
Which nights are actually worth trading?
The nights that follow weakness. After three consecutive down closes on QQQ, the next overnight session averaged +14.3 basis points against +4.1 after an up close — and, unusually, the following day session averaged +30.5 basis points instead of its usual small loss. Buying the close after three down closes and selling the next close produced 584 trades since 1999, 56.7% winners, +0.35% net per trade after 0.05% per side, a 7.1% annual return with a -18.7% maximum drawdown, and only 8.5% time in the market.
Why does the overnight effect exist?
Nobody has proved a single cause, and we do not claim one. The credible explanations are that earnings and macro news are released outside trading hours and are priced into the open, that overnight risk carries a premium because you cannot manage a position while the exchange is closed, and that index funds and futures-linked flows concentrate around the open and close. Any of those would produce the pattern. For a trader, the useful part is not the why but the arithmetic: the edge per night is roughly five basis points, and your costs decide whether you keep it.
Is the overnight effect still working in 2026?
The overnight leg is, but its advantage has narrowed. Out-of-sample from 2013 to 2026, the overnight session earned a Sharpe ratio of 1.03 — better than the 0.95 it earned before. What changed is the other side: the day session stopped losing money, earning a Sharpe of 0.46 out-of-sample after -0.26 in-sample. The spectacular version of the headline, where the day session destroys wealth, belongs to the dot-com bust and the financial crisis. The overnight tilt itself has persisted.

Robin Eriksson
Founder of EdgeLab. Five years of discretionary losses taught me to test everything — now I publish the strategies that survive. About me →
Related: Does Connors' RSI(2) still work? We tested it on the Nasdaq · The RSI 30/40 strategy: buy the Nasdaq at 30, sell at 40 — every trade from 23 years · Buying the dip in QQQ: 23 years of evidence, net of costs