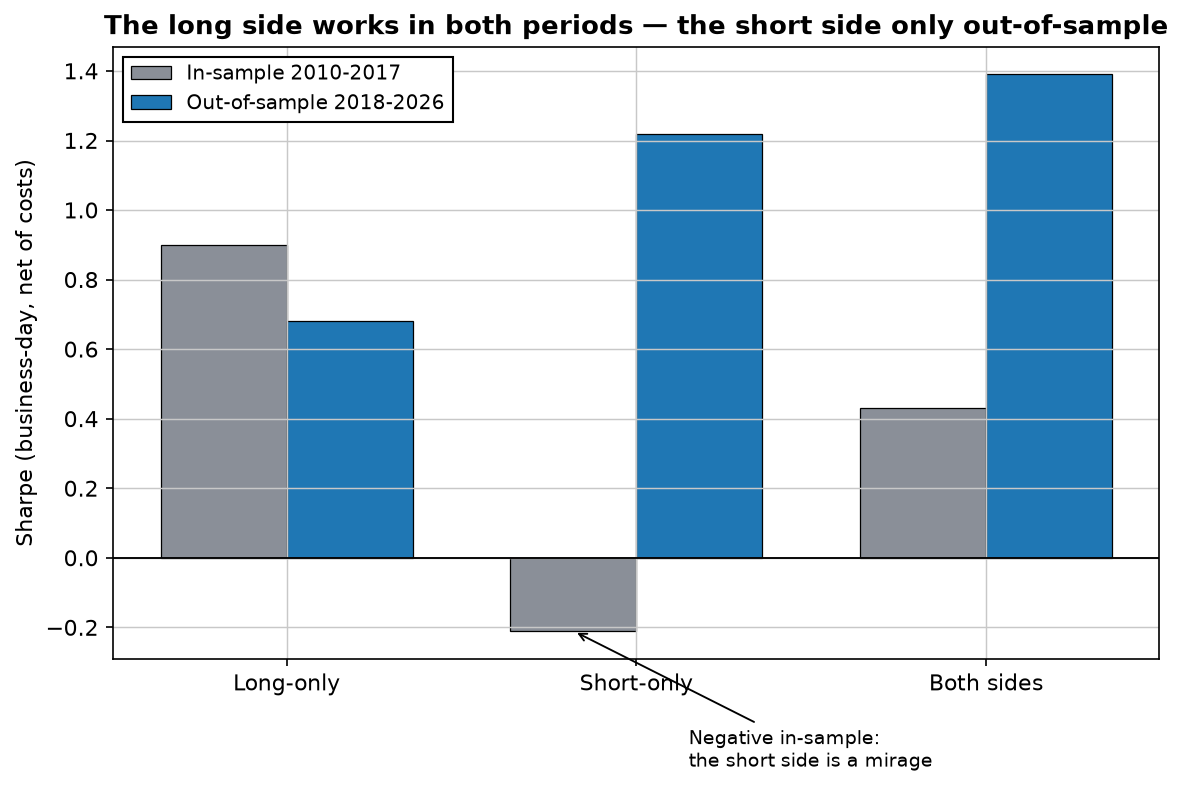
The short version: the intraday momentum strategy travels to the Nasdaq — but only long-only. The long side is positive in both periods (business-day Sharpe 0.90 in-sample, 0.68 out-of-sample; 1.55 and 1.18 if you count only trading days), net of costs. The short side is negative in-sample (-0.21) and only profitable out-of-sample — the textbook signature of period-specific luck, not an edge. And the eye-catching "both-sides" Sharpe of 1.39 is riding that short-side luck. The honest read: a real but modest long-only edge, and a short side you shouldn't trust no matter how good its recent record looks.
What the strategy actually does
Intraday momentum, in the Zarattini/Aziz/Barbon formulation, is a "keep going" strategy. Through the day it builds a noise area around the open — bands set by how far price has typically wandered from the opening print by that minute, measured over the last fortnight. When price pushes outside that noise area, it's moving more than usual, and the strategy goes with it: long on an upside break, short on a downside break. It rides the move with a trailing stop at the session VWAP and closes everything at the bell. No overnight risk, re-entries allowed if price breaks out again.
It's an elegant idea with a real academic pedigree, and on the S&P 500 the paper reports spectacular numbers. The question we care about is narrower and more useful: does it survive on a different market, split honestly into its two directions, net of costs?
The paper is the S&P — we ran the Nasdaq
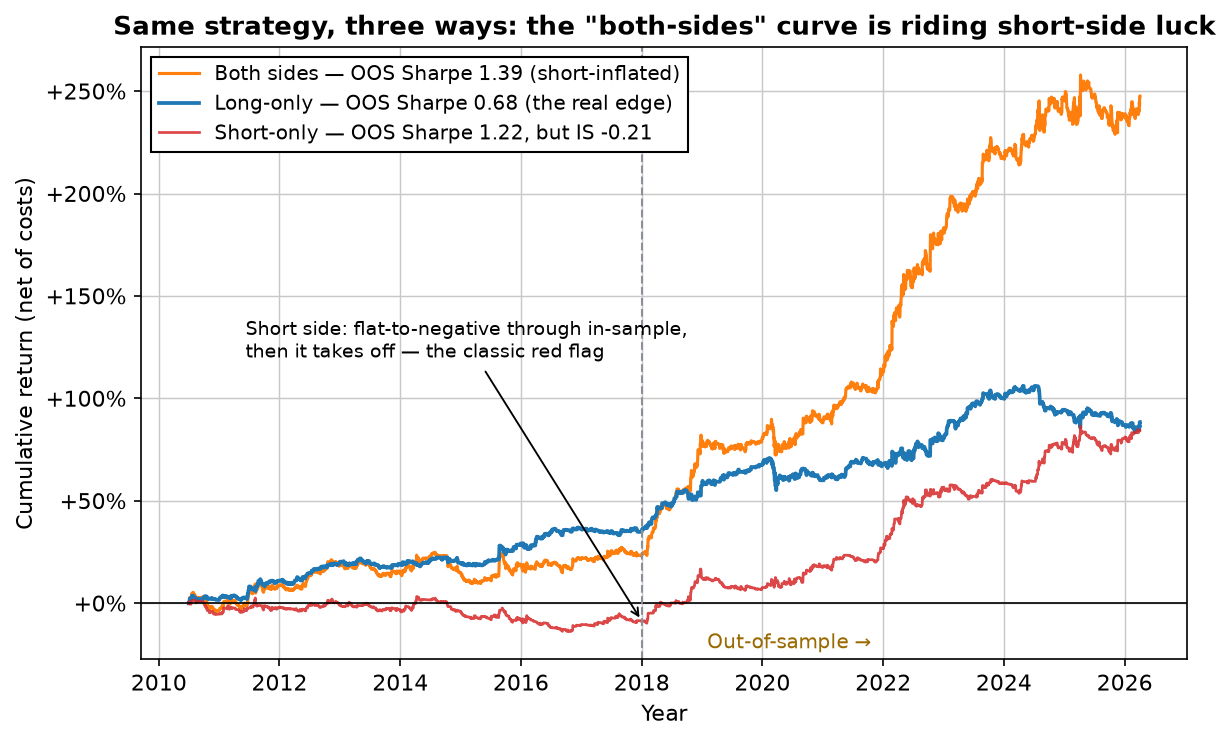
Same logic, rebuilt on Nasdaq-100 futures (NQ), one-minute Databento data, 2010–2026. Parameters were locked on 2010–2017 (14-day noise window, VWAP stop) and everything after 1 January 2018 is out-of-sample. All figures net of a modeled 0.01% round-trip cost. Here is the same strategy run three ways — long-only, short-only, and both:
The long side is real
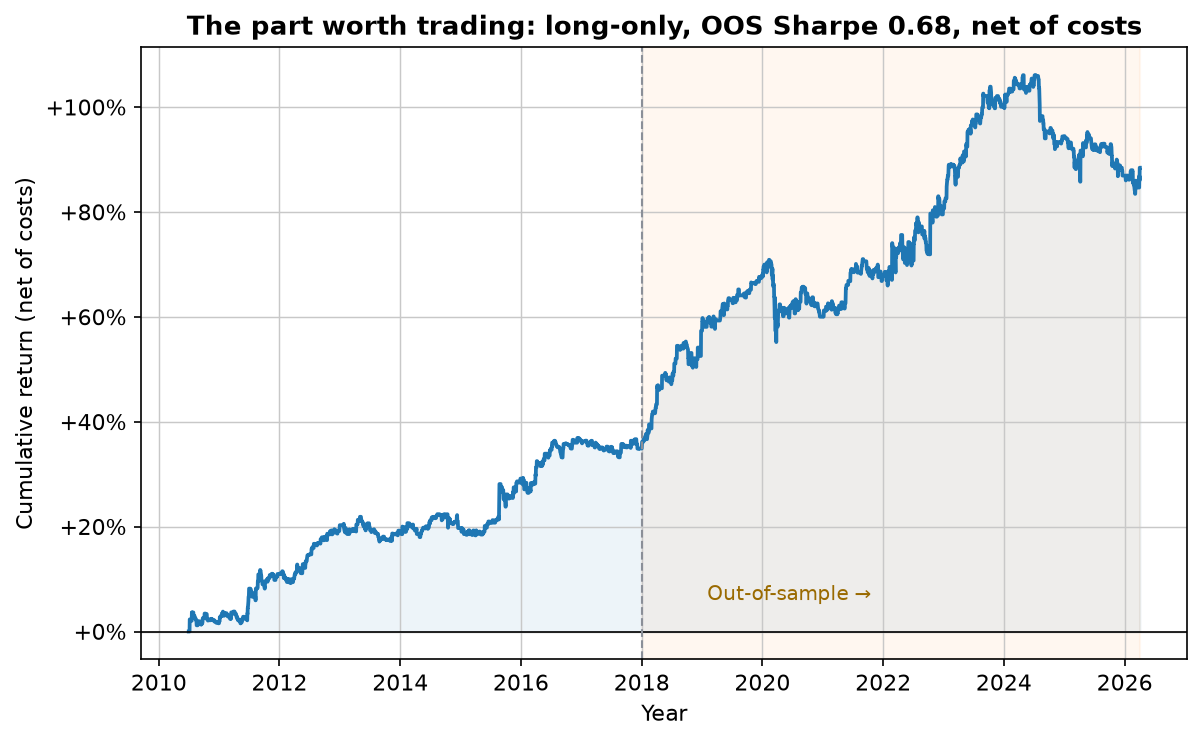
Start with the good news, because it's genuine. Long-only intraday momentum on the Nasdaq earned a business-day Sharpe of 0.90 in-sample and 0.68 out-of-sample — it got a little worse on unseen data, which is normal and honest, but it stayed clearly positive, with a bootstrap 5th-percentile Sharpe above zero. Six of nine out-of-sample years were positive. This is a modest, real edge: buy the upside breakout, trail it, go home flat.
The short side is a mirage
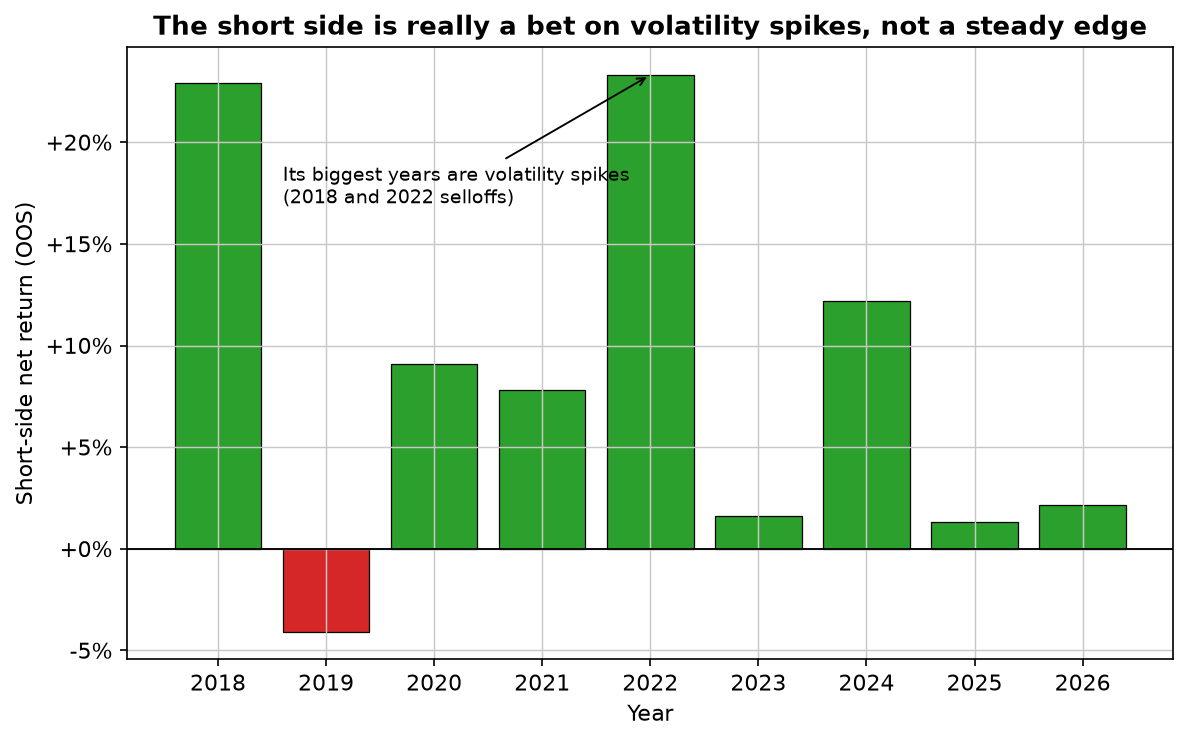
Now the part the headline numbers hide. Short-only intraday momentum — sell the downside breakout — had a business-day Sharpe of -0.21 in-sample. It lost money across the seven years we'd use to build and trust it. Then, out-of-sample, it printed a Sharpe of 1.22 and more than doubled. A strategy that fails on its design data and only works afterwards hasn't found an edge; it has found a period. This is the exact pattern we reject every day.
Why the "both-sides" number is a trap
Put the two halves together and you get the book everyone wants to quote: a business-day Sharpe of 1.39 out-of-sample (1.75 across trading days), 13% a year, a -9% drawdown. It looks like the best strategy on the site. It isn't — it's the long side's real 0.68 plus the short side's out-of-sample fluke, averaged into one seductive curve. Because the short side's in-sample Sharpe is negative, we have no honest reason to expect its out-of-sample generosity to continue. Trust the number you can see in both halves of history, not the one that only shows up in the recent half.
| Business-day Sharpe (net of costs) | In-sample 2010-2017 | Out-of-sample 2018-2026 |
|---|---|---|
| Long-only (real) | 0.90 | 0.68 |
| Short-only (mirage) | -0.21 | 1.22 |
| Both sides (short-inflated) | 0.43 | 1.39 |
Read it across, not down. The only row that's positive in both columns is the long side. Everything the combined book gains over the long side comes from a column that has a minus sign next to it in-sample.
Lab notes
What made this one click was splitting the book before looking at the totals. Run "both sides" and you get a Sharpe near 1.4 and a curve that begs to be published; I nearly did. It was the short side's in-sample number — minus 0.21, sitting right there under a glorious out-of-sample run — that stopped me. I reproduced all three books from the trade logs, 4,700-odd trades, and the tell was consistent: the long side earns its keep in both halves of the data; the short side only shows up for the second half. Same reason a good month proves nothing until you have looked at the bad ones.
Download the free strategy report
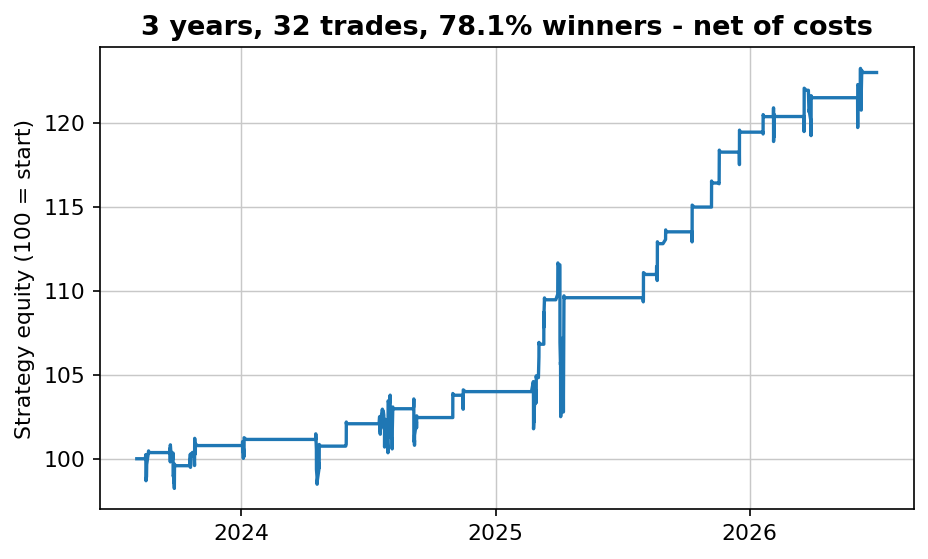
Simple and robust — 70% winners across 155 trades over 16 years, net of costs. The free PDF gives you the market, the timeframe and the exact rules in plain English, plus every single trade it has taken.
Instant delivery. One PDF, no spam. Unsubscribe anytime.
FAQ
Does the Zarattini intraday momentum strategy work?
Partly. On 16 years of Nasdaq futures the long side held up — a business-day Sharpe of 0.90 in-sample and 0.68 out-of-sample (1.55 and 1.18 measured only across trading days), net of costs. The short side did not: it was negative in-sample (-0.21) and only made money out-of-sample, the signature of regime luck rather than a durable edge. Long-only is the version worth trading.
Does intraday momentum work on the Nasdaq, not just the S&P 500?
The long side travels. The original "Beat the Market" paper tests SPY; we rebuilt it on Nasdaq-100 futures 1-minute data from 2010 to 2026 and the long side stayed positive both in and out of sample, at a more modest Sharpe than the paper's headline. The short side does not reproduce on the Nasdaq — it loses money in-sample.
Why is the short side a mirage?
Because it lost money on the very data used to design it (in-sample Sharpe -0.21) and only turned profitable out-of-sample. Its biggest years are the 2018 and 2022 selloffs — it behaves like a bet on volatility spikes, not a steady edge. The much-quoted "both-sides" Sharpe of 1.75 (across trading days) is inflated by that short-side luck and should not be assumed to repeat.
Can a retail trader run this strategy?
It is one of the most cost-sensitive strategy families there is — it trades intraday, many times, on small edges that spreads and slippage erode fast. Our numbers are net of a modeled 0.01% round-trip cost; real execution on 1-minute data will be worse. It needs intraday data, automation and discipline — not a set-and-forget retail system.

Robin Eriksson
Founder of EdgeLab. Five years of discretionary losses taught me to test everything — now I publish the strategies that survive. About me →
Related: Is the opening range breakout dead? We tested it on the Nasdaq · ICT Silver Bullet strategy: what 16 years of Nasdaq futures say about its win rate · Linda Raschke's Holy Grail trading strategy, tested: as written, it almost never trades