The short version: the Friday effect in gold is real — +0.109% on the average Friday vs +0.009% on Mondays since 2004, with 56% of Fridays closing up. But the edge per trade is almost exactly one round-trip commission, so as a buy-Thursday-sell-Friday strategy it nets out to roughly zero after costs. One filtered version — Fridays when VIX is above 20 — survives as a small satellite trade if your execution is cheap; I trade it myself and the exact rules are in this article. The pattern's main value remains: timing entries you were going to make anyway.
The pattern
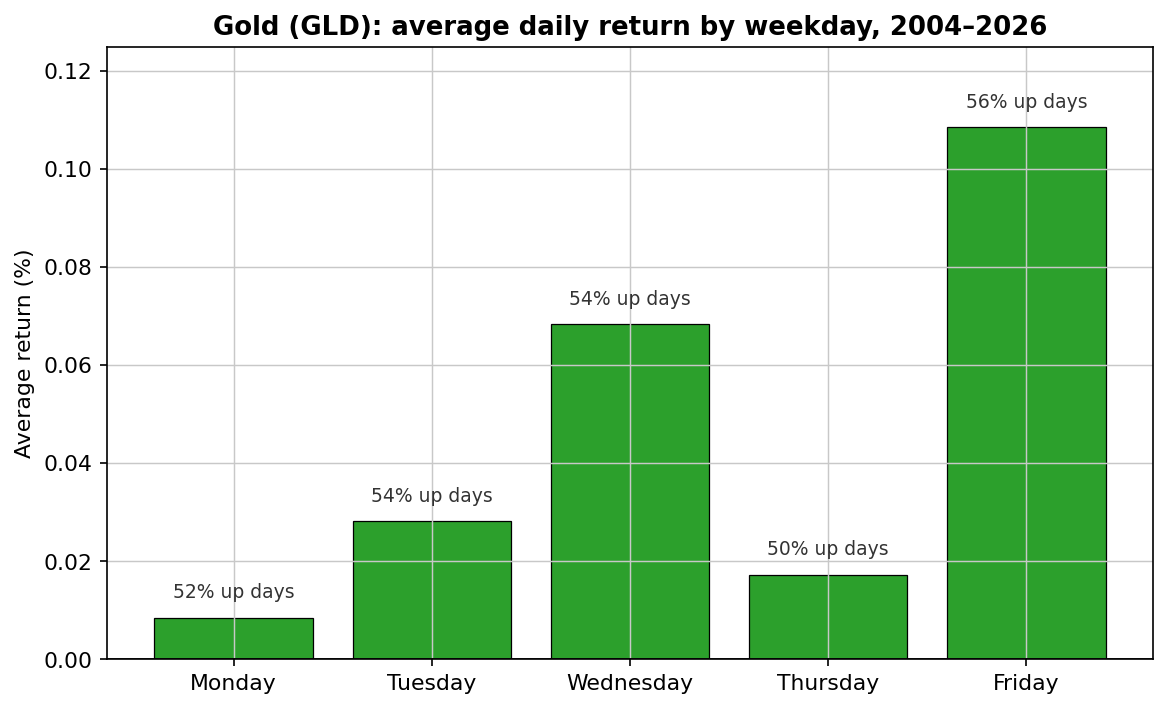
The numbers behind the chart: Monday +0.009%, Tuesday +0.028%, Wednesday +0.068%, Thursday +0.017% — and Friday +0.109%. Summed over two decades, nearly half of gold's day-by-day gains came from one weekday out of five.
The usual explanation is weekend risk. Markets close for two days; geopolitical surprises don't. Traders who want protection over the weekend buy it while they still can, and that hedging demand concentrates late in the week. It's a plausible mechanism — but like most seasonality stories, it was written after the data was found. We treat it as an empirical pattern, not a law.
The strategy version — and where it breaks
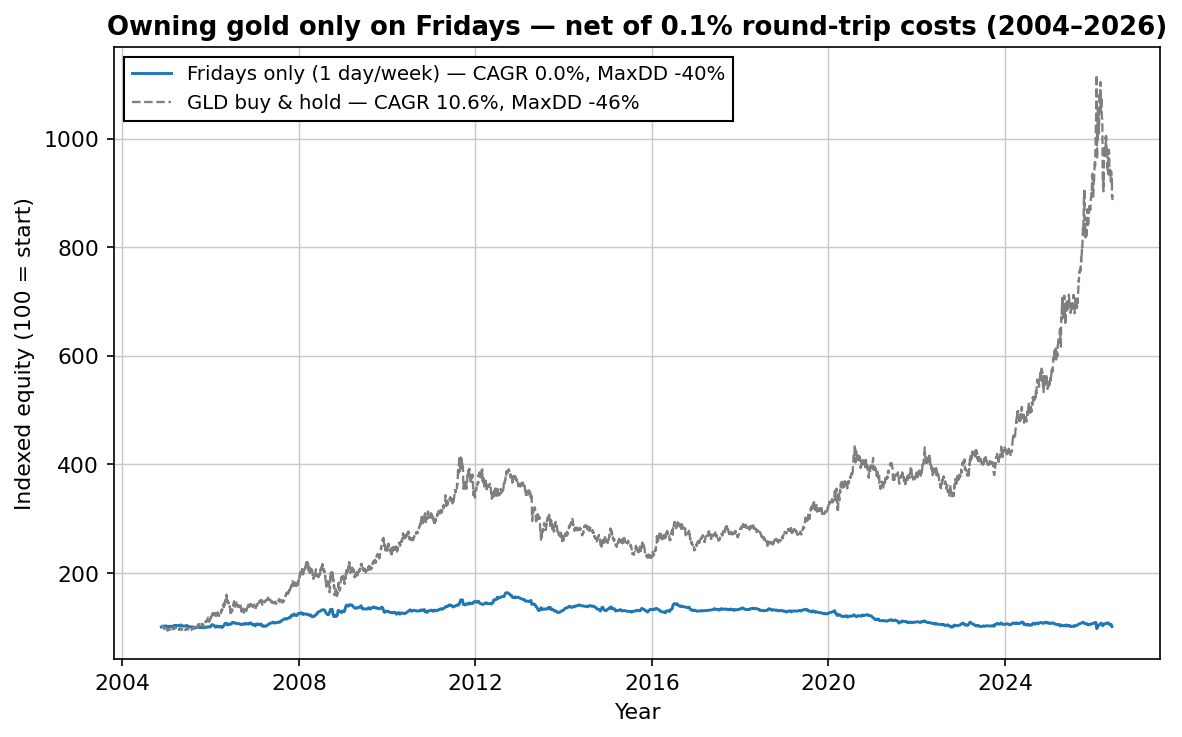
The obvious trade: buy GLD at Thursday's close, sell at Friday's close. One day a week in the market, about 52 trades a year. Here's that strategy net of a realistic 0.10% round-trip cost:
| Metric | Fridays only (net of costs) | GLD buy & hold |
|---|---|---|
| CAGR | 0.0% | 10.6% |
| Sharpe ratio | 0.05 | 0.65 |
| Max drawdown | -40.3% | -45.6% |
| Win rate | 50.8% | — |
| Trades | 1,088 | 0 |
The arithmetic is unforgiving: the average Friday gain is +0.109%, and a realistic retail round trip costs about 0.10%. The edge and the cost are the same number. Gross of costs this "strategy" compounds nicely; net of costs it's a donation to your broker. Most writeups of this effect simply never run the net-of-costs version.
We tried two filters. One made it worse.
Could a filter concentrate the effect into fewer, better Fridays? We tested the two most commonly suggested ones:
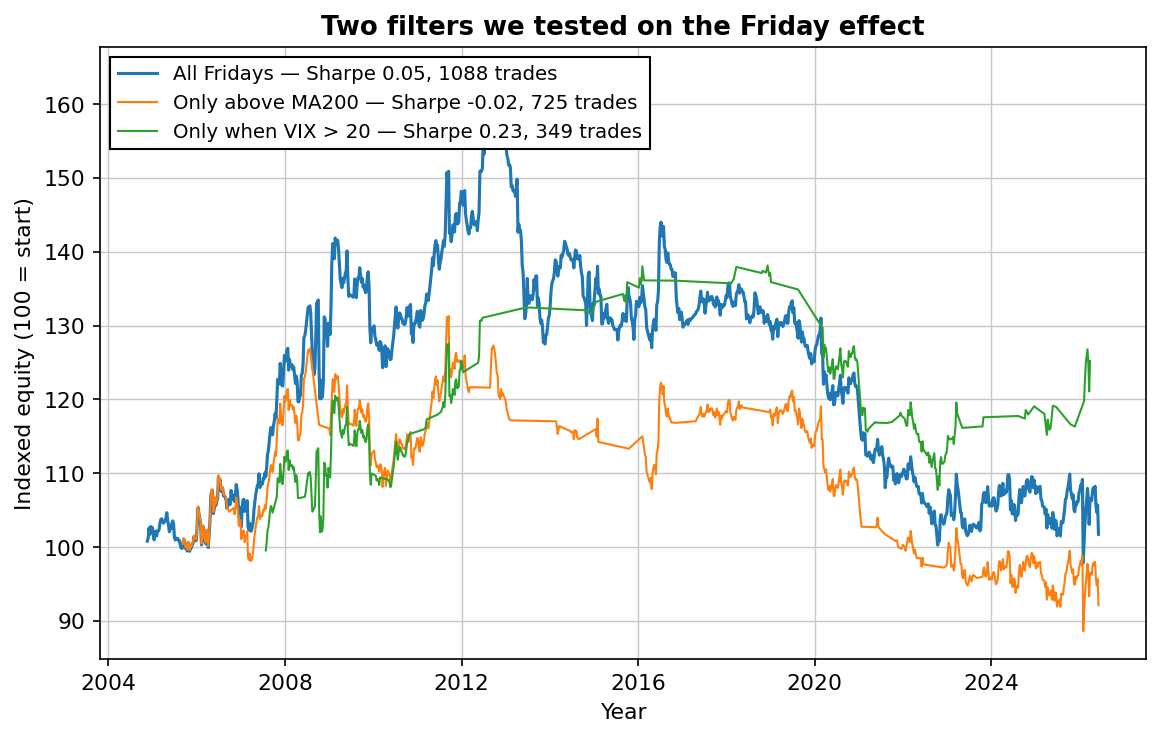
- Only when gold is above its 200-day average: CAGR fell to -0.4%. The trend filter that helps most strategies removed the best Fridays — the effect is strongest in fearful markets, which often sit below trend.
- Only when VIX closed above 20 the day before: Sharpe improved to 0.23 (from 0.05) with a third of the trades and roughly half the drawdown. Consistent with the weekend-hedging story: the effect concentrates when there's something to fear. Still only ~1.2% CAGR net of 0.10% costs — better, not a career.
The version I actually trade
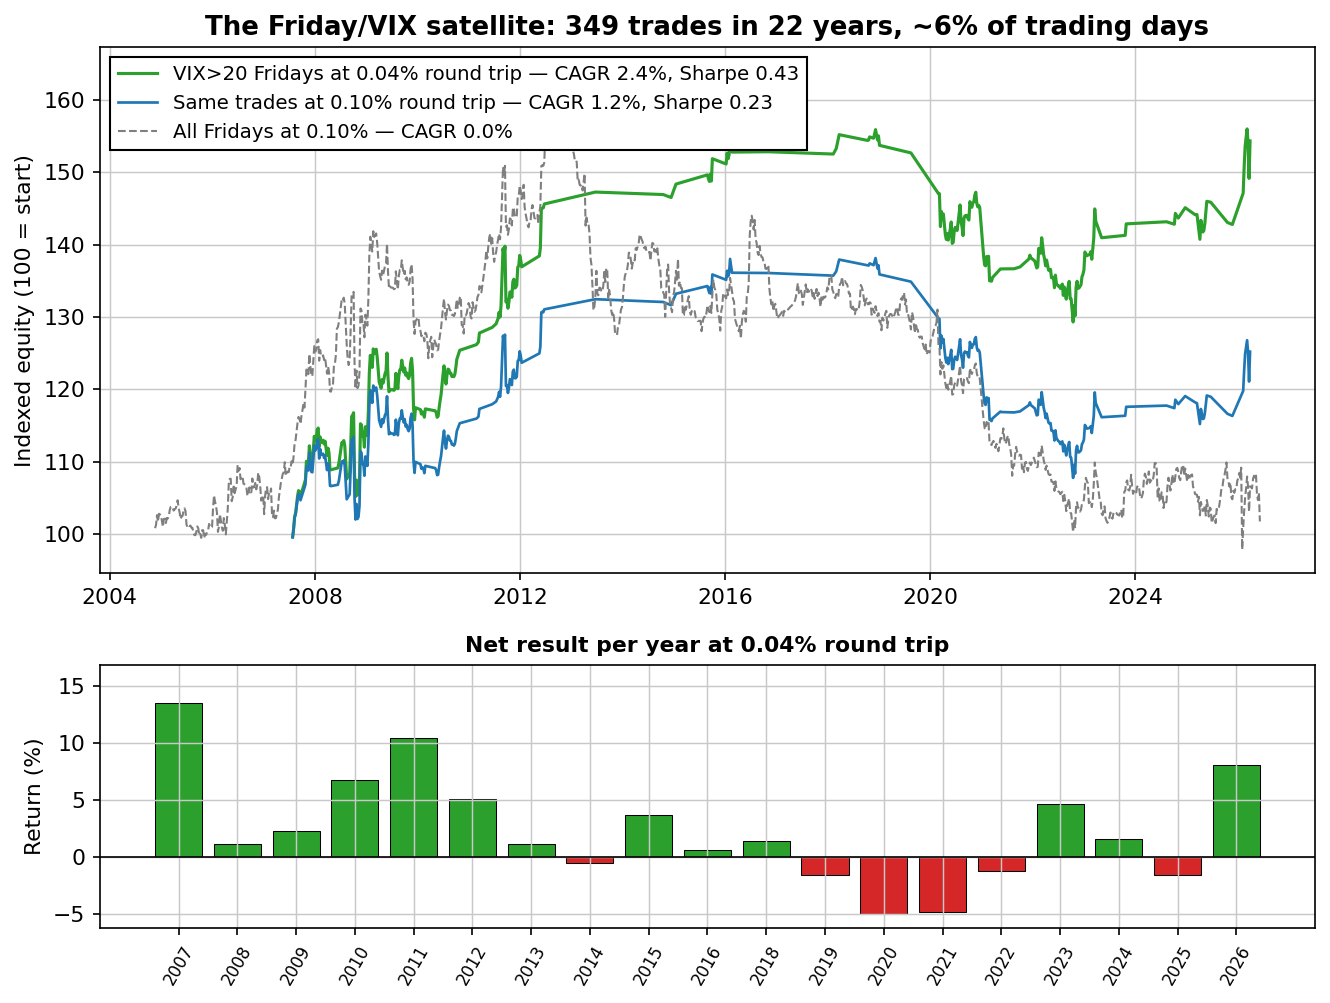
Full disclosure: I trade the VIX-filtered version myself. Not because the headline CAGR is impressive — you just saw it isn't — but because almost everything that's wrong with this strategy is a cost problem, and costs are the one thing you control. Here is the same set of 349 trades in two cost worlds: our standard conservative assumption (0.10% per round trip) and what a liquid gold ETF actually costs to trade with limit orders at a decent broker (closer to 0.04%):
| Period | CAGR at 0.10% RT | CAGR at 0.04% RT | Win rate | Trades |
|---|---|---|---|---|
| 2004–2011 | +5.3% | +7.7% | 59.5% | 168 |
| 2012–2018 | +1.4% | +1.7% | 56.8% | 37 |
| 2019–2026 | -1.1% | +0.1% | 51.4% | 144 |
| Full period | +1.2% | +2.4% (Sharpe 0.43) | 55.9% | 349 |
Why trade something that's been flat for seven years? Three reasons, honestly weighed:
- It uses capital that would sit idle anyway. The signal fires about 16 days a year — 6% of trading days. It stacks on top of whatever else you run; it doesn't compete for capital.
- It earns its keep in exactly the weeks everything else hurts. The profitable clusters are 2008, 2011, 2020 — high-fear regimes where equity strategies bleed. I think of it as a cheap option on fear, not an income stream.
- The thesis is still intact. Weekend-hedging demand is a structural story, and the filtered win rate (56% at realistic costs) hasn't collapsed — the per-trade edge has just gotten thinner. If fear regimes like 2004–2011 return, the position is already in the playbook.
What it is not: a core strategy. If your execution costs are anywhere near 0.10% per round trip, the math says don't bother — see the blue curve. This is also why we publish every backtest net of deliberately conservative costs: an edge that only exists at perfect execution isn't an edge, it's a coin flip with fees.
The exact rules — free PDF, no email needed
The complete Friday/VIX rules on one page — entry, exit, the cost math that decides whether it's worth trading, and the stats above. Written platform-free: run it manually, or code it in TradingView, MetaTrader or Python in ten minutes.
Want a full strategy report in your inbox too? Download the free strategy.
And it's fading
Splitting the 21 years into three blocks makes the trend obvious:
| Period | Avg Friday return | Fridays up | Observations |
|---|---|---|---|
| 2005–2011 | +0.213% | 60.9% | 353 |
| 2012–2018 | +0.069% | 53.1% | 354 |
| 2019–2026 | +0.041% | 54.9% | 375 |
Still positive, but a fifth of its former size. This is what published anomalies usually do once everyone can read about them.
What the pattern is actually good for
Here's the practical takeaway we'd actually use: the Friday effect is a timing overlay, not a strategy. If you're accumulating gold anyway — as a portfolio sleeve, a hedge, or part of a system like our ETF rotation test — the data says to place your buys before Friday and your sells after it, rather than the reverse. That captures the tilt without paying a single extra commission. Free edges are rare; this is one of the few.
Want strategies that survive the net-of-costs test?
Join the list and get the free strategy report — the market, the timeframe and the exact rules in plain English, costs included, every trade shown.
No spam. Unsubscribe anytime.
FAQ
Is the Friday gold effect real?
Yes, in the data: +0.109% on the average Friday versus +0.009% on Mondays across 21 years of GLD, with 56% of Fridays closing up. Nearly half of gold's cumulative daily gains landed on Fridays.
Can you trade it profitably?
Not as a core strategy — the per-trade edge roughly equals one realistic round-trip cost, so the unfiltered net CAGR in our test was 0.0%. The VIX>20 filtered version earned ~2.4% CAGR (Sharpe 0.43) at cheap execution, using capital only 6% of days — viable as a satellite trade, dead at 0.10% round-trip costs.
Why does gold rise on Fridays?
The standard explanation is weekend hedging demand — protection bought before two days of closed markets. Plausible, supported by the VIX-filter result, but ultimately a story written after the pattern was found.
Does it still work in 2026?
It has faded: from +0.21% per Friday in 2005–2011 to +0.04% in 2019–2026. Positive, but a fraction of what the older articles describe.

Robin Eriksson
Founder of EdgeLab. Five years of discretionary losses taught me to test everything — now I publish the strategies that survive. About me →
Related: Does "sell in May and go away" work? 33 years of SPY, tested · Toby Crabel's NR7 breakout, tested on stocks, gold and bitcoin — 1,850 trades · The Turnaround Tuesday strategy — rules and 23 years of backtest data