The short version: the summer slump is real — over 33 years of SPY the winter half-year (Nov–Apr) averaged about 7% versus about 4.3% for summer (May–Oct), and winter beat summer in 5 of the last 6 five-year blocks. But "sell in May and go away" the strategy is still a mistake: going to cash each summer returned 6.7% a year versus 10.8% for buy-and-hold, with a worse Sharpe (0.55 vs 0.64). The only thing it bought was a shallower worst drawdown (-37% vs -55%). Even the smart version — bonds instead of cash — lost to buy-and-hold on return. Real pattern, bad trade. The data's below.
Two things are usually confused in this debate, and separating them is the whole article. One: is summer really weaker than winter for stocks? Two: can you make money acting on it? The answer to the first is a clear yes. The answer to the second is a clear no — and the gap between those two answers is one of the most useful lessons in seasonal trading.
The pattern is real: summer is the weak half
Here's the average return of SPY in each calendar month across 33 years, with the "summer" months (May–October) marked. This isn't a strategy yet — just the raw seasonal shape:
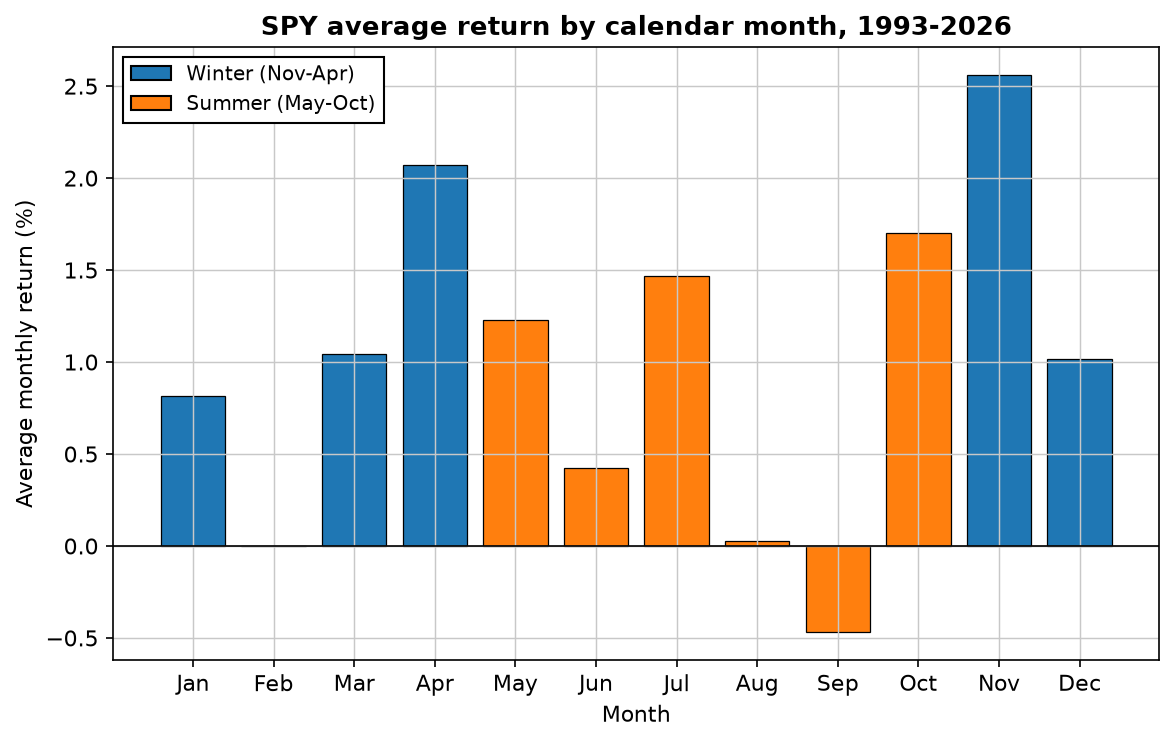
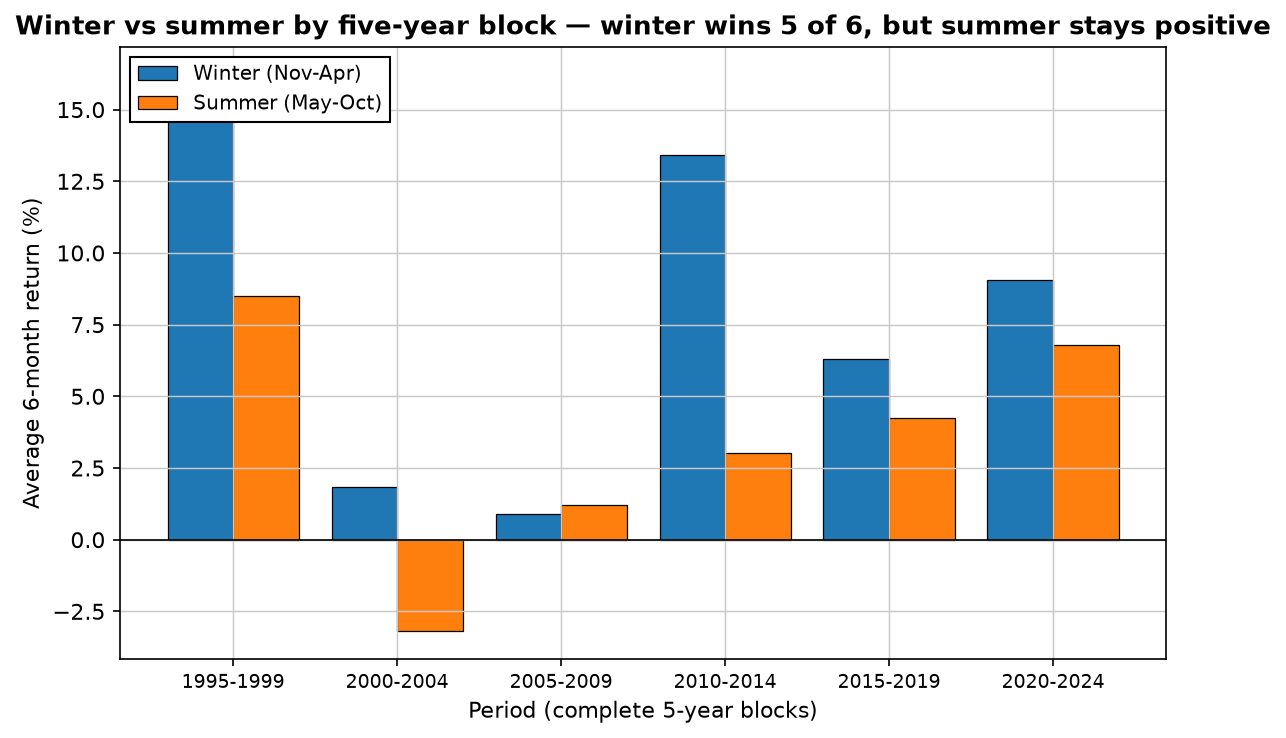
Put numbers on it: the six winter months compounded to about a 7% average half-year return, the six summer months to about 4.3%. That's a meaningful gap — summer delivered roughly 40% less than winter. And it's persistent, not a one-decade fluke:
The strategy fails: you sit out gains, not just risk
If summer is weaker, selling in May should help — that's the intuition. It doesn't, and the reason is in the chart above: summer is weaker but still positive. When you sell in May and go to cash, you're not dodging losses most years; you're skipping smaller gains. Over 33 years that adds up to a lot of forgone compounding:
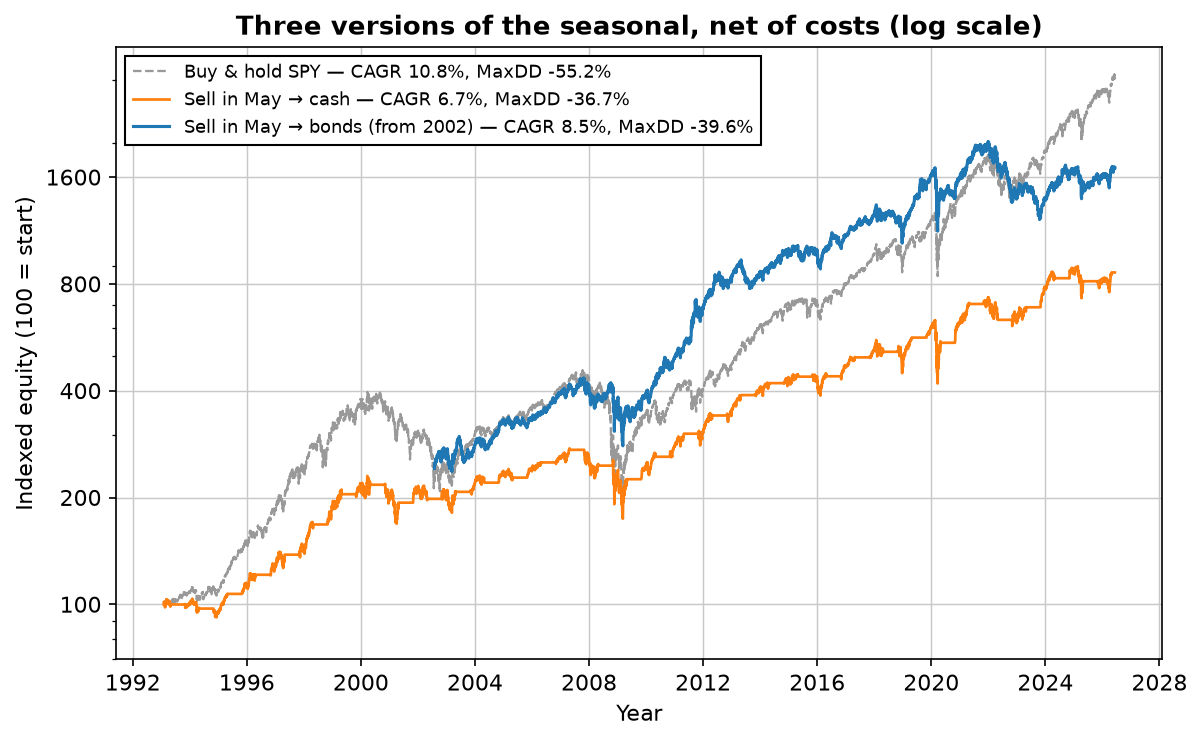
Read the scoreboard like a skeptic. Buy-and-hold: 10.8% a year, Sharpe 0.64, worst drawdown -55%. Sell in May to cash: 6.7%, Sharpe 0.55, worst drawdown -37%. So the cash version didn't just lose on raw return — its risk-adjusted return was worse too. The one and only thing it improved was the max drawdown, and that's because sitting in cash through the autumn dodged the tail of 2008. If a shallower worst-case is the specific thing you need, fine — but you're paying roughly four percentage points a year for it, which is a very expensive insurance policy.
The least-bad version: bonds, not cash
There's an obvious fix to "cash earns nothing all summer": park in something that does. Holding SPY in winter and long-term Treasuries (TLT) in summer earned 8.5% a year since 2002 — better than the cash version, but still short of buy-and-hold's 11.2% over the same window, at a similar Sharpe (0.57 vs 0.66) and a smaller drawdown (-40% vs -55%). It's the least-bad version, and it leans on the same idea our portfolio math is built on — pair assets that don't slump at the same time. But be honest about what it is: a way to hold a bit less equity risk, not a way to make more money.
What this actually teaches
"Sell in May" is a near-perfect example of a trap we see constantly: a real statistical pattern that is not a tradable edge. The seasonality passes every test for existence — persistent, decades-long, visible in the monthly averages. It fails the only test that matters for your account: after you act on it and pay costs, are you better off? You're not. This is exactly why every strategy on this site has to clear a net-of-costs, risk-adjusted bar before it earns the word "works" — and why so many famous patterns don't.
Lab notes
One thing that surprised me while running this: summer is positive more often than winter (79% of summers were up versus 76% of winters), it's just positive by less. That's the whole illusion in one sentence — "summer is weak" gets misheard as "summer is dangerous," so people picture themselves dodging crashes. Mostly they'd be dodging perfectly good +4% summers. I charged 0.05% on each of the two switches a year, which barely dents it — the strategy's problem isn't costs, it's the premise. Data is SPY total-return from our frozen cache, so dividends are included; a cash-only version that ignored dividends would look even worse.
Download a free strategy
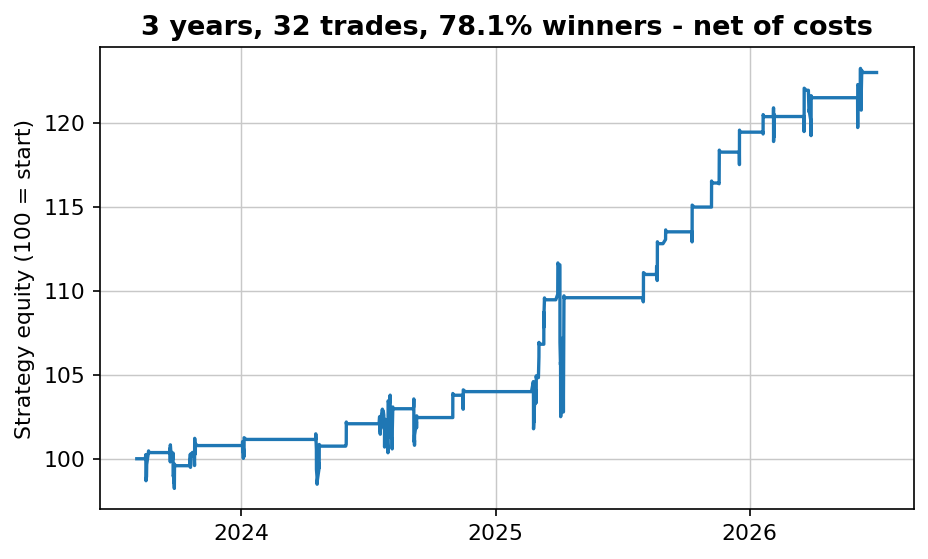
Simple and robust — 70% winners across 155 trades over 16 years, net of costs. The free PDF gives you the market, the timeframe and the exact rules in plain English, plus every single trade it has taken.
Instant delivery. One PDF, no spam. Unsubscribe anytime.
FAQ
Is "sell in May and go away" real?
The pattern is. Over 33 years of SPY the winter half (Nov–Apr) averaged ~7% vs ~4.3% for summer (May–Oct), winter beat summer in 5 of 6 five-year blocks, and September is the only month with a negative average. Summer really is the weaker half.
Does the sell-in-May strategy beat buy and hold?
No. Selling to cash each summer returned 6.7% a year vs 10.8% for holding, with a worse Sharpe (0.55 vs 0.64). Only the max drawdown improved (-37% vs -55%). Summers are weaker but still positive, so you skip gains, not just risk.
Is there a version that works better?
Bonds instead of cash: SPY in winter, TLT in summer earned 8.5% a year since 2002 vs 11.2% for buy-and-hold, similar Sharpe, smaller drawdown. Least-bad version — a drawdown trade, not a return improvement.
Why is September historically bad?
It's the only month with a negative average in our sample; reasons are debated (tax positioning, autumn crashes clustering in 2008/2001). But an average isn't a rule, and a single-month seasonal never cleared our net-of-costs bar.

Robin Eriksson
Founder of EdgeLab. Five years of discretionary losses taught me to test everything — now I publish the strategies that survive. About me →
Related: The Turnaround Tuesday strategy — rules and 23 years of backtest data · The Friday gold effect: a real pattern you probably can't trade · How to backtest a trading strategy in Python — and the four mistakes that inflate every result