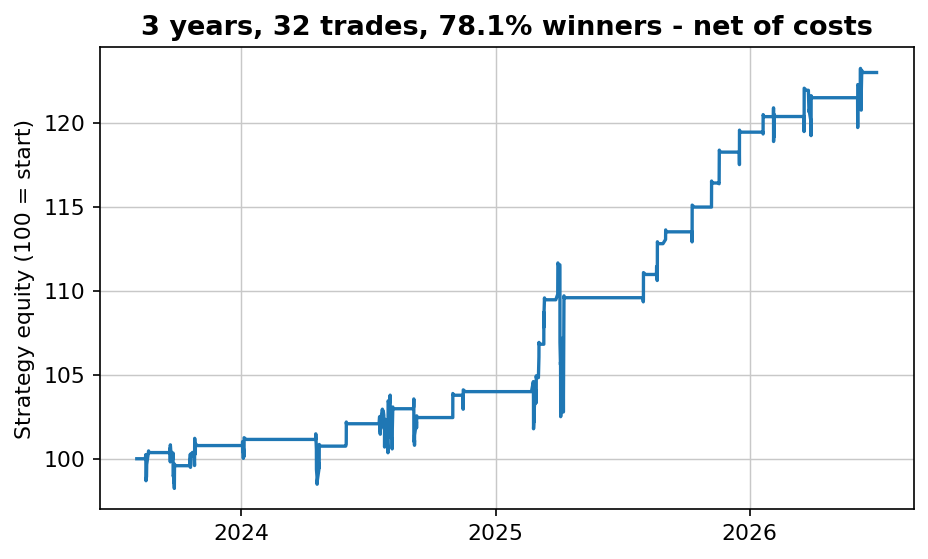
The short version: we ran three strategy types — mean reversion, Turnaround Tuesday, and a trend overlay — through a standard prop challenge (+10% target, -5% daily loss, -10% total loss) on every start date from 2003 to 2026, net of costs. Holding a mean-reversion strategy at 2x sizing, moving the profit target from +5% to +20% moved the pass rate from 74% to 33%. Moving the daily loss limit across its normal range (-3% to -7%) moved it from 27% to 63% — a swing you get for free by reading the fine print. And the killer isn't even the same across strategies: mean reversion dies fast to the daily rule, trend dies slow to the total rule. Match your strategy to the rule that hunts it, and the target takes care of itself.
Three strategies meet the same rules
A prop firm hands you an account, three numbers and a promise: hit +10% to get funded, but never lose 5% in a day or 10% in total, and you keep a cut of what you make after. Simple to state. We wanted to know what those numbers actually do to a real strategy, so we simulated every trading day from 2003 to 2026 as a fresh challenge start — thousands of attempts — for three strategies that lose money in genuinely different ways:
- Mean reversion (QQQ): buy the close when 2-day RSI is below 25 — a classic dip-buyer that's long precisely when the market is falling.
- Turnaround Tuesday (QQQ): buy a down Monday, exit on strength — short-hold, also a weakness-buyer.
- Trend overlay (SPY): long only while an adaptive moving average says the trend is up — in cash during crashes, invested during grinds.
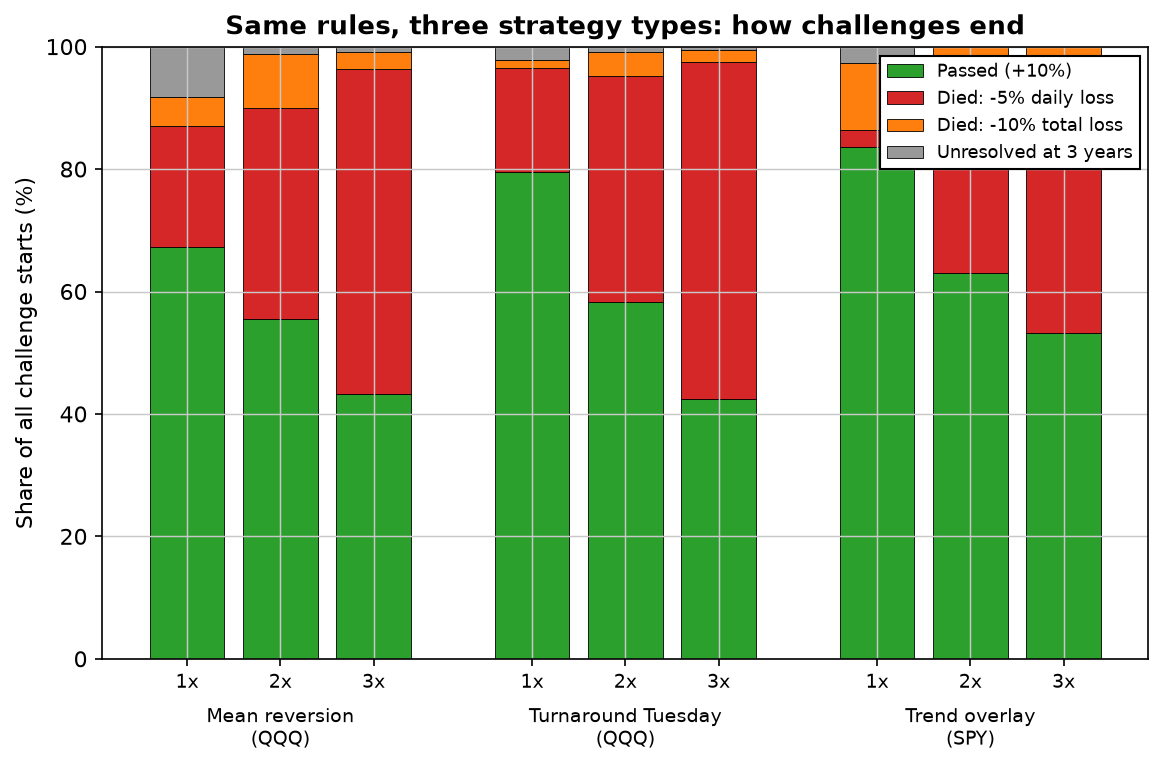
At sensible 1x sizing all three pass most of the time (67–84%), which is the honest good news prop content usually skips. But watch what kills the ones that fail — because it's not random, and it's not the target.
Mean reversion dies fast; trend dies slow
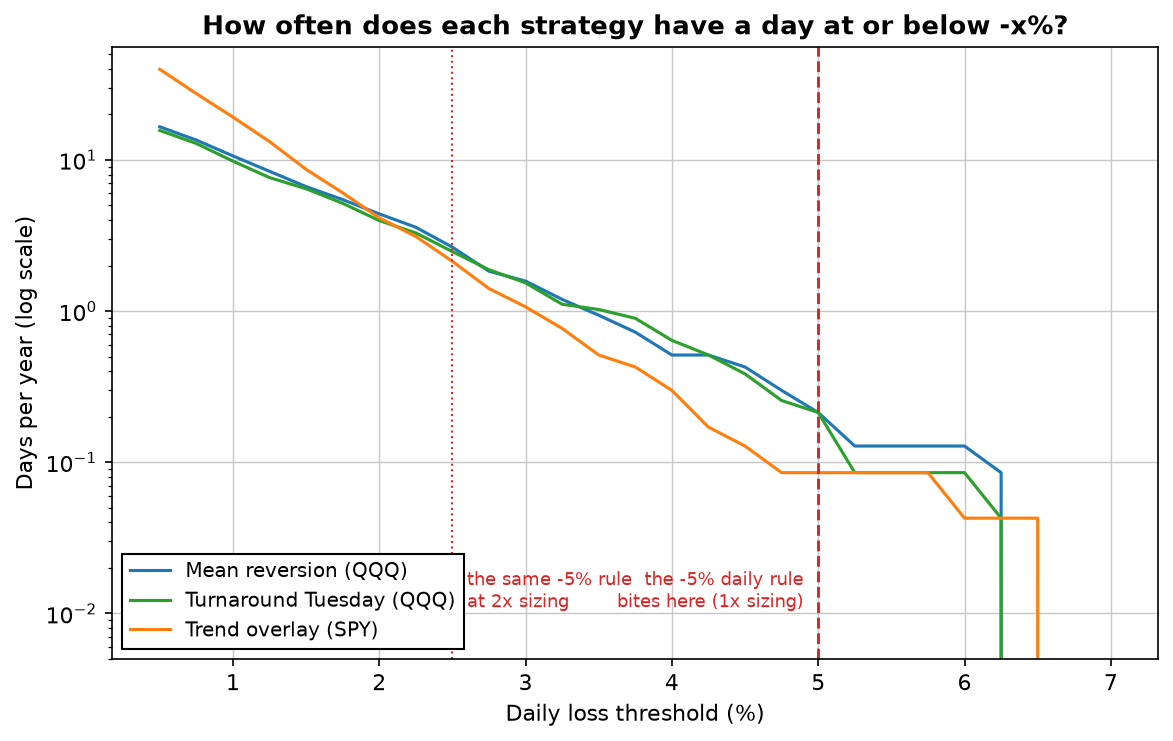
The dip-buyers — mean reversion and Turnaround Tuesday — die to the daily loss limit (the red blocks), 17–20% of the time even at 1x. That's not bad luck. A strategy that buys weakness is defined by being in the market on the ugliest days; its edge and its daily-limit risk are the same behaviour wearing two hats. The trend overlay is the opposite: it sits in cash through panics, so only 2.7% of its challenges die to a single bad day — but it rides long, shallow drawdowns fully invested, and 10.9% of its challenges bleed out against the total loss limit instead.
That's the whole insight in one line: a strategy's exit door is decided by how it loses. To see why the daily door is so lethal for dip-buyers, count their bad days directly:
The lever you're watching vs the lever that decides
Now the experiment that names the article. Take mean reversion at 2x, hold everything fixed, and move exactly one rule at a time:
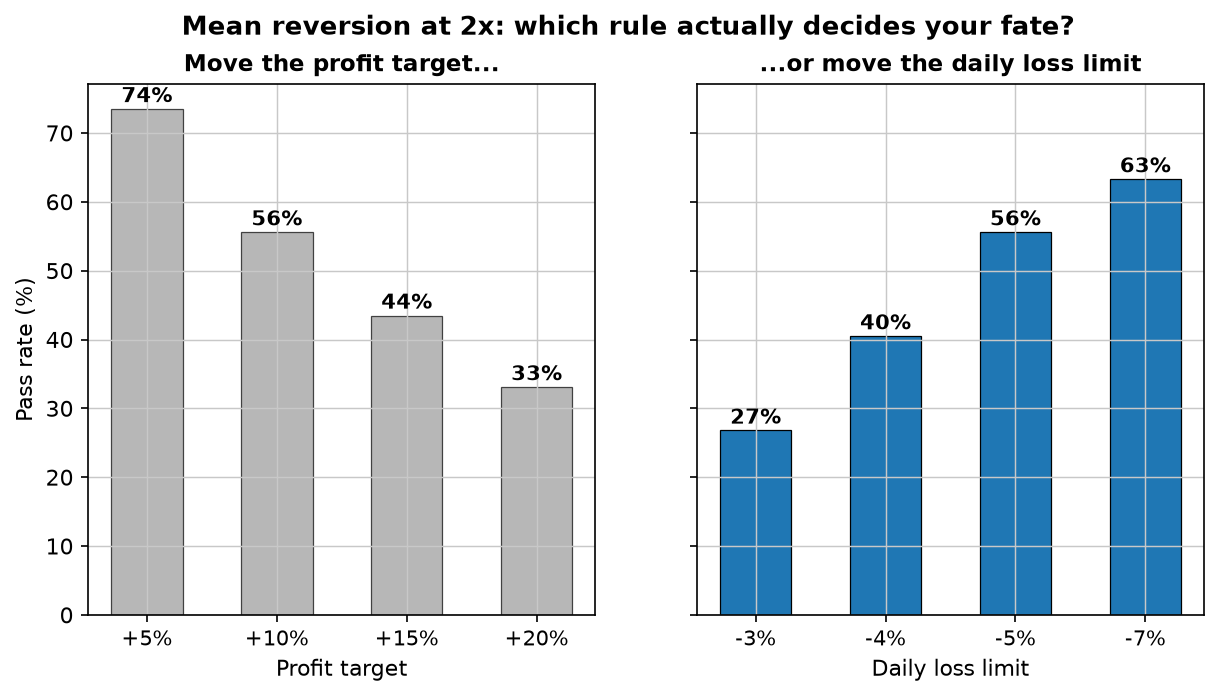
Here's why the right panel matters more even though the swings look similar. The profit target is a number you can pace toward — trade smaller, wait longer, and +10% is the same +10% whether it takes two months or twenty. The daily loss limit is a single-day tripwire: once you've sized big enough that one ordinary bad session clips -5%, no amount of patience saves you. You can out-work a target. You cannot out-trade a tripwire you've already armed. And unlike your sizing, the limit is set before you start — by which firm you picked. A -4% daily limit and a -5% daily limit are two different businesses, and the pass rates prove it (40% vs 56% here). Almost nobody compares firms on that number.
What to actually do
- Pick the firm by its daily loss limit, not its payout split. A one-point difference in the daily rule outweighs most fee and split differences. It's the first number I'd read, not the last.
- Size against the daily limit, then check the target. Find the sizing where a normal-bad day stays comfortably inside the daily rule; whatever target that leaves you is the target you can actually hit. Doing it the other way around — sizing up to reach the target faster — is exactly how the daily rule collects.
- Know how your strategy loses. A dip-buyer needs daily-limit headroom; a trend follower needs total-limit headroom. Our full FTMO simulation shows the same effect on a single strategy across 5,600 attempts, and the drawdown distribution tells you how bad a "normal bad day" can really get.
Lab notes
These challenge starts overlap — every trading day is a start, so neighbouring attempts share most of their data and are not independent samples. I state that plainly because it's the honest weakness of any "we simulated N challenges" article, including our FTMO one: the pass rates are trustworthy, but you can't treat 5,000 overlapping attempts as 5,000 coin flips for a confidence interval. One thing that genuinely surprised me: the trend overlay's timeout share fell to literally 0% at 2x and 3x — sized up, it always resolves one way or the other well inside three years, because a fully-invested book simply can't sit still that long. Cash is what buys you time; leverage spends it.
Download a free strategy
Simple and robust — 70% winners across 155 trades over 16 years, net of costs. The free PDF gives you the market, the timeframe and the exact rules in plain English, plus every single trade it has taken.
Instant delivery. One PDF, no spam. Unsubscribe anytime.
FAQ
What matters more, the profit target or the daily loss limit?
The daily loss limit — it's the one traders underestimate. At 2x sizing on mean reversion, moving the target +5%→+20% cut pass rate 74%→33%; moving the daily limit -3%→-7% swung it 27%→63%. You can pace toward a target; you can't out-trade a single-day tripwire you've already armed.
Why do mean-reversion strategies fail daily loss limits?
They're long precisely on panic days — a dip-buyer's worst days are the market's worst days. Mean reversion and Turnaround Tuesday died to the daily rule ~18–20% of the time at 1x, versus under 3% for a trend overlay that sits in cash during crashes.
How does a trend strategy die instead?
Slowly. Rarely down 5% in a session, but fully invested through long shallow drawdowns, so it hits the -10% total limit (~11% of challenges) rather than the daily one (~3%). Different strategy, different killer.
Does sizing up help you pass faster?
It cuts median time to pass sharply (206→39 trading days from 1x to 3x on mean reversion) but feeds the daily rule even faster — deaths by daily loss rose 20%→53%. Size against the daily limit, not the target.

Robin Eriksson
Founder of EdgeLab. Five years of discretionary losses taught me to test everything — now I publish the strategies that survive. About me →
Related: Can a mechanical strategy pass an FTMO challenge? We ran 5,600 of them · Your worst drawdown is still ahead of you: 10,000 Monte Carlo reshuffles · Does the 200-day moving average work? Tested on five assets