The short version: yes — a real, honestly-backtested strategy passed the FTMO 2-step challenge in 62% of attempts at normal position size. The two catches: the median pass took 357 trading days (about 17 months), and the obvious fix — trading bigger — feeds the 5% daily-loss rule, which already accounts for most failures. The challenge isn't impossible for systematic traders. It's a tax on exactly the things that make systematic strategies good.
The setup
The rules, from FTMO's published trading objectives as of June 2026 (2-step "FTMO Challenge"): reach +10% in step one and +5% in step two, never lose more than 5% in a day or 10% total, minimum four trading days, no time limit. The fee for an attempt is a few hundred euros, refundable after you pass and take your first payout.
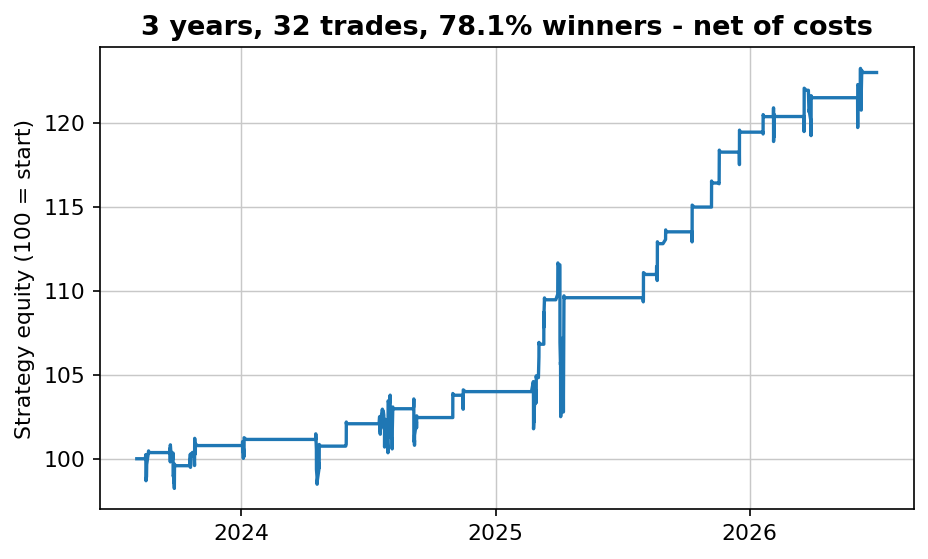
The strategy is the public dip-buyer we used in the buyer's-checklist article: buy QQQ at the close when 2-period RSI is below 25, sell the next close, net of 0.05% per side. Long-run profile: 9.3% a year, Sharpe 0.77, in the market roughly a third of the time. Not our best strategy — deliberately. It's representative of what a decent retail system actually looks like.
Method: walk the real 2003–2026 return sequence from every possible start date and run the full two-step challenge — 5,600 overlapping attempts. No bootstrap, no reshuffling: crash days stay clustered the way they actually happened, because that clustering is precisely what kills challenges.
The result
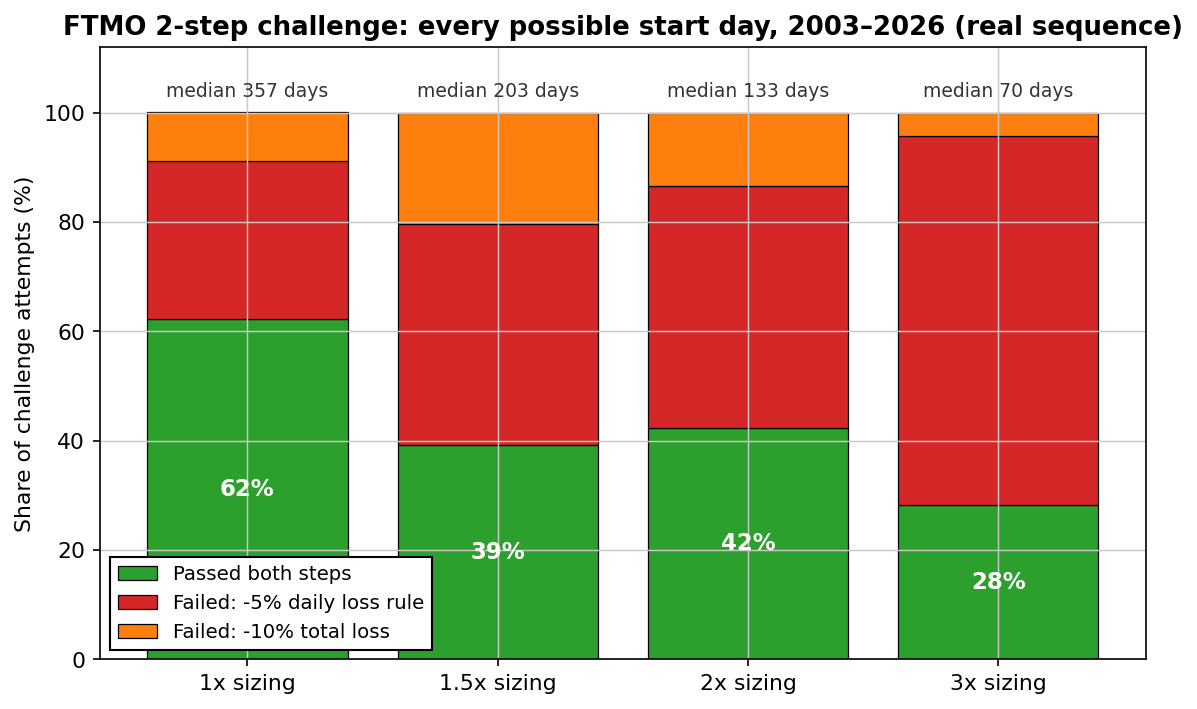
| Sizing | Passed | Died: daily loss | Died: total loss | Median days to pass | 90th percentile |
|---|---|---|---|---|---|
| 1x | 62.2% | 29.0% | 8.9% | 357 | 903 |
| 1.5x | 39.3% | 40.3% | 20.4% | 203 | 357 |
| 2x | 42.4% | 44.3% | 13.3% | 133 | 294 |
| 3x | 28.3% | 67.5% | 4.2% | 70 | 156 |
Read the first row again. At honest size, the strategy passes more often than not — but the median successful run is about 17 months, and one in ten took over 3.5 years. "No time limit" is a generous rule that quietly transfers the cost from fees to your calendar.
Why the daily-loss rule hates good strategies
Here's the structural problem, and it's not FTMO-specific. Mean reversion makes its living buying panic — which means it is in the market precisely on the days the market falls apart. Its worst days aren't randomly distributed; they're the market's worst days, by design.
Across 23 years, the strategy had exactly 5 days at or below -5% — all in crash weeks like 2008 and 2020. Five days in 5,900. But every challenge window that overlaps one of them dies instantly, which is how a five-day list becomes 29% of all attempts. Lever up to 2x and suddenly 61 ordinary bad days clear the breach threshold. At 3x, two-thirds of all attempts end in execution by tripwire.
The bitter irony: on those five catastrophic days, the system was doing exactly what 23 years of evidence says it should do. The same trade that gets you funded in month twelve gets you deleted in month one — the rule can't tell the difference between recklessness and mean reversion.
The wrinkle we didn't expect
Look at the table once more: 2x passed more often than 1.5x (42% vs 39%). That's not noise — it's the two loss rules interacting. At 1.5x you're big enough to take real drawdowns but slow enough to linger in them, so the 10% total-loss rule catches more victims (20.4%, the worst of any sizing). At 2x you either die fast or reach the target before the total-loss rule matters. We point this out because honest simulations produce this kind of awkward, non-monotonic result — smooth curves are usually a sign someone cleaned the data.
What passing costs in time
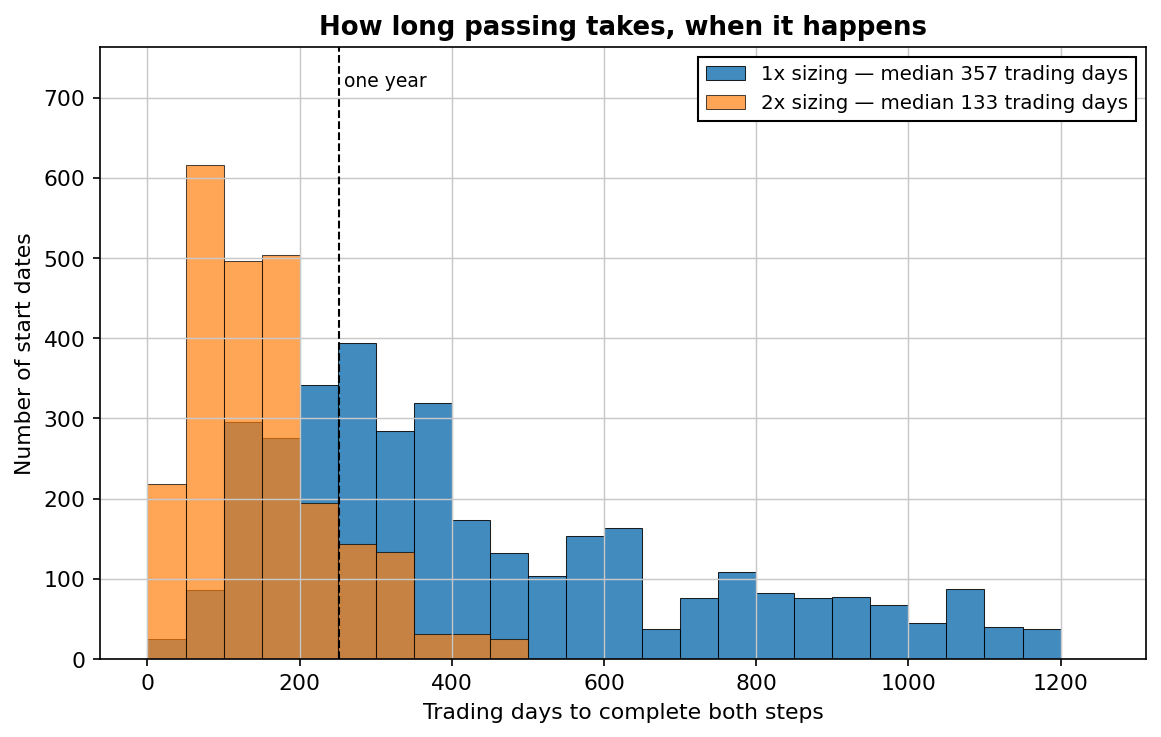
Expected-value math, kept simple: at 2x, a 42% pass rate means about 2.4 attempts per funding on average — call it three fees and a year of calendar time. That's actually fine if the funded account delivers: an 80–90% split on a six-figure simulated account dwarfs those costs. The expensive scenario is the one the table can't show — quitting in attempt two, convinced the strategy is broken, when nothing about the strategy changed.
What this means in practice
- If you want to run challenges with a system: size at 1x and budget 12–24 months, or accept a coin-flip pass rate for speed. The strategy's quality barely moves these numbers; the rule structure dominates.
- Shrink the worst day, not the average day. The lever that actually helps isn't a better entry — it's a structurally smaller left tail: lower per-trade exposure, several uncorrelated strategies sharing the risk budget, or hard intraday stops if your system tolerates them (ours doesn't — that's a tested fact, not a preference).
- Or pick a venue whose rules don't fight your edge. A platform without daily tripwires — we wrote up Darwinex Zero from a systematic trader's perspective here — trades slower payouts for rules that don't execute you for following your own system.
Start from strategies that survive testing
Whatever venue you choose, the input is the same: simple, robust strategies with an honestly measured worst case. Get the free strategy report — the market, the timeframe and the exact rules in plain English, every trade shown, honest caveats.
No spam. Unsubscribe anytime.
FAQ
Can a systematic strategy pass an FTMO challenge?
Yes: 62% of our 5,600 simulated attempts passed both steps at normal size. But the median pass took 357 trading days, and the daily-loss rule caused most failures — structurally, not through bad luck.
What's the biggest killer — the 10% drawdown or the 5% daily loss?
The daily loss, at every sizing we tested. Mean reversion's worst days are the market's worst days, so the rule binds exactly when the strategy is doing its job.
Should I size up to pass faster?
Understand the trade first: 3x cuts the median to 70 days but drops the pass rate to 28%. If you do it, do it knowing you're buying speed with attempts.
Is FTMO rigged against systematic traders?
"Rigged" is the wrong word — the rules are public and our simulation passed more often than not. But the rule set taxes overnight exposure and panic-buying, which is most of what daily-timeframe systematic trading is. Know that before paying the fee.

Robin Eriksson
Founder of EdgeLab. Five years of discretionary losses taught me to test everything — now I publish the strategies that survive. About me →
Related: Prop firm math: why the daily loss limit matters more than the profit target · Does the 200-day moving average work? Tested on five assets · When is a strategy dead? Three statistical tripwires we use