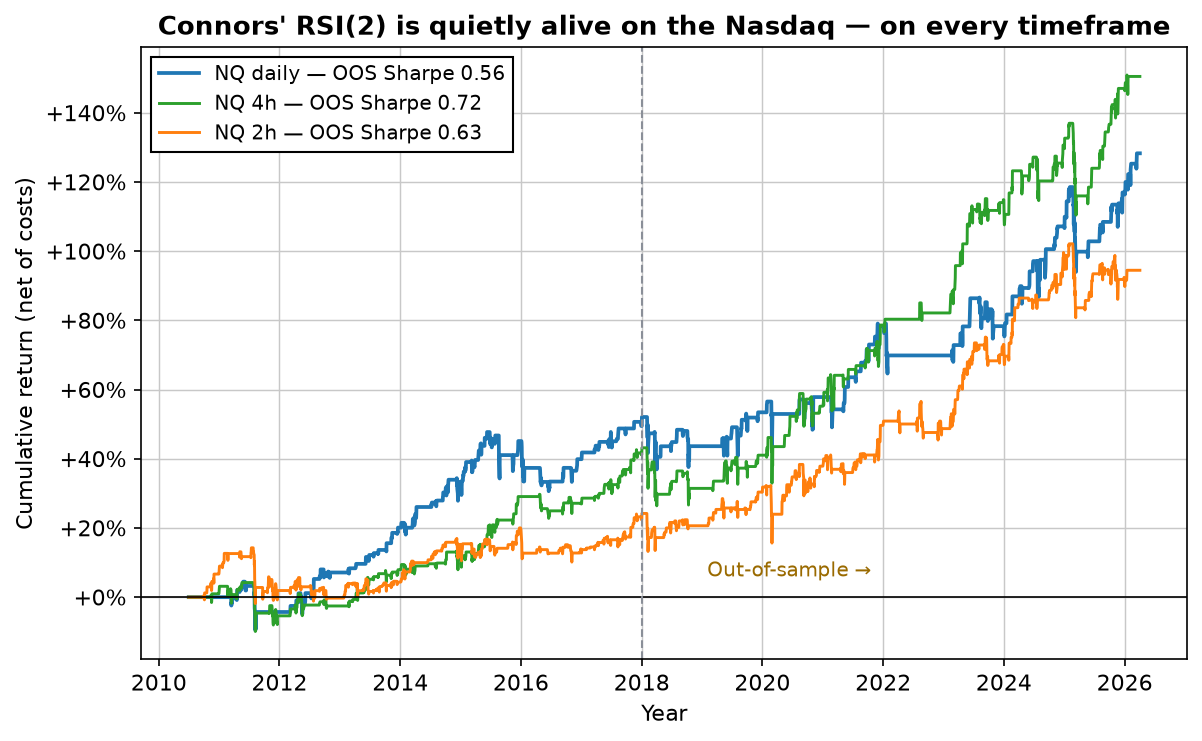
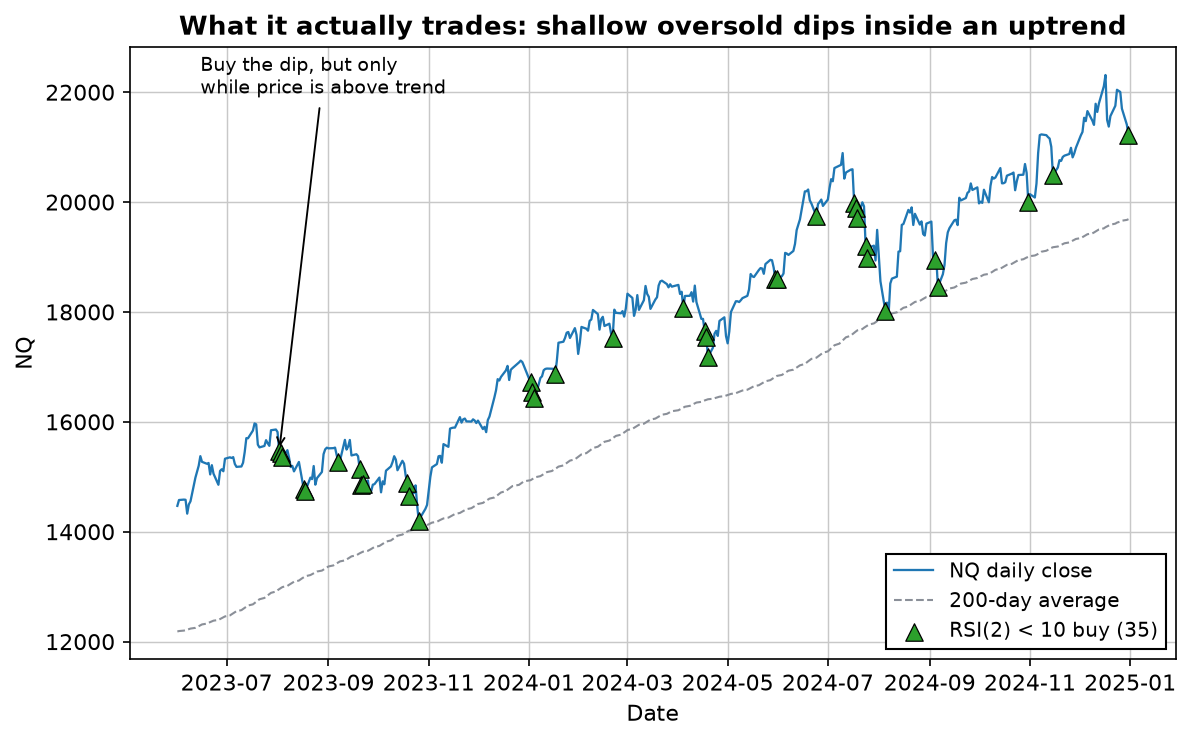
The short version: Connors' RSI(2) is not dead on the Nasdaq. Buying shallow oversold dips (RSI below 10, above the 200-day trend) earned an out-of-sample Sharpe of 0.56 on daily bars, 0.63 on 2-hour and 0.72 on 4-hour, net of costs — and even Connors' elaborate TPS scale-in earned 0.78. Modest, real, and remarkably consistent across timeframes. The honest catch is different: those timeframes are the same trade (correlations of 0.5–0.76), and the edge is so widely run that it barely diversifies anything you already own. It didn't die — it got crowded. That's the difference between a strategy that's broken and one that's simply owned by everyone.
Why everyone says RSI(2) is dead
Two reasons, and both contain a grain of truth. First, it's been published to exhaustion — Connors' own books, a thousand blog posts, every backtesting course — so the intuition is that any edge that visible must be arbitraged away by now. Second, the naive version genuinely misbehaves: run RSI(2) with no trend filter and it happily buys dips all the way down in a bear market, taking drawdowns near -18% out-of-sample on the Nasdaq. Catch a few of those and you'd declare it dead too.
So we tested it the way we test everything: honestly, net of costs, with the most recent eight years locked away as out-of-sample, on a market (Nasdaq futures) liquid enough to trust the fills.
We tested it — it's quietly alive
Same rule on three timeframes: RSI(2) below 10 on daily bars, RSI(3) below 15 on 2-hour and 4-hour bars, each requiring price to be above its 200-period average, exit when RSI recovers. Out-of-sample (2018–2026), net of a 0.01% round-trip cost:
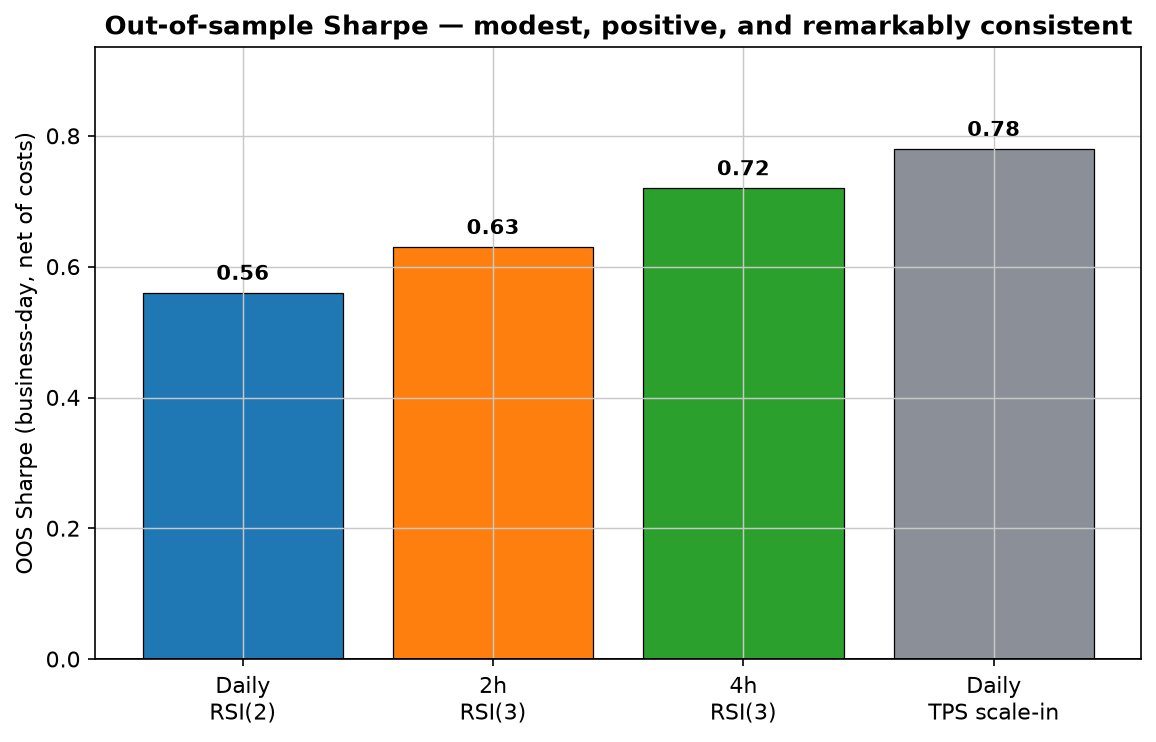
Notice the rightmost bar. Connors' TPS — the elaborate version that scales into a position in four tranches as a dip deepens — is often held up as the "sophisticated" RSI(2), and just as often dismissed as over-fit. On our data it earned an out-of-sample Sharpe of 0.78, right in line with the simple versions. The complexity neither killed the edge nor meaningfully improved it. That's worth sitting with: the fancy variant and the five-line variant land in the same place.
What the 200-day filter actually does
Here's a result that mirrors our 200-day moving-average study. Adding the trend filter — only buy dips while price is above its 200-day average — barely changed the Sharpe (on the 2-hour timeframe the unfiltered version actually scored a little higher out-of-sample). What it reliably did was cut the drawdown by about a third, from roughly -17% to -11% across timeframes. The filter isn't where the return comes from; it's insurance against buying the one dip that doesn't bounce.
So why do serious traders still pass on it?
Not because it's broken — because it's saturated. Look at how the three timeframes move together:
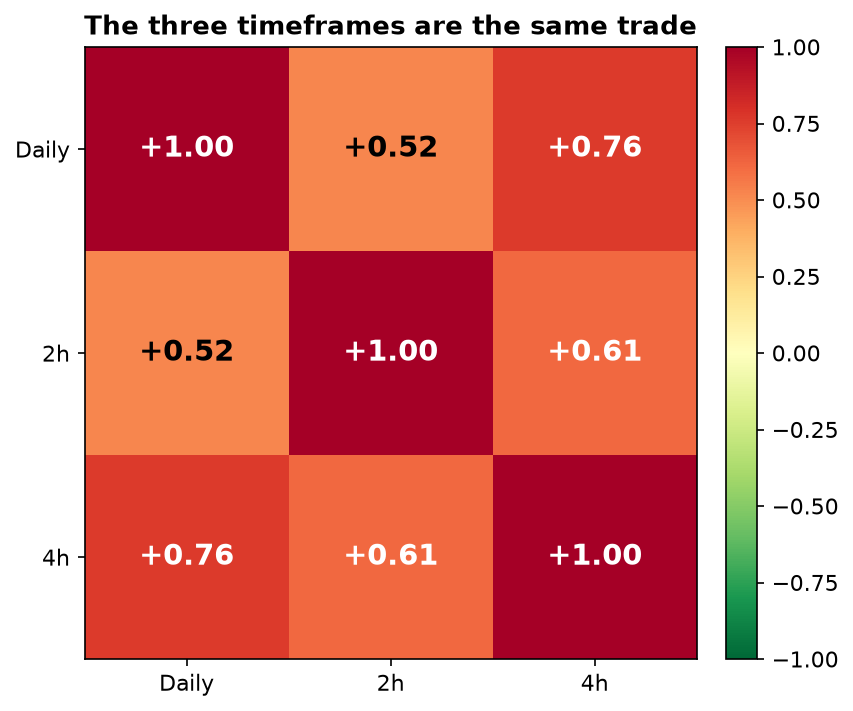
This is the honest reason RSI(2) "fails the bar" in a professional book, and it's the point we keep coming back to in the strategy graveyard: most rejected strategies aren't dead, they're already owned. RSI(2) oversold dip-buying overlaps almost every other equity-index mean-reversion trade on the planet — including ones you're probably already running. Adding it to a portfolio that already dips buys the Nasdaq gives you almost no new return per unit of new risk. Reject it, and you're rejecting the redundancy, not the edge.
| Business-day Sharpe, net of costs | In-sample 2010-2017 | Out-of-sample 2018-2026 | OOS max drawdown |
|---|---|---|---|
| Daily RSI(2) + 200-day filter | 0.68 | 0.56 | -11.2% |
| 2h RSI(3) + filter | 0.37 | 0.63 | -12.6% |
| 4h RSI(3) + filter | 0.61 | 0.72 | -11.7% |
| Daily TPS scale-in | 0.72 | 0.78 | -10.2% |
| Daily RSI(2), no filter | 0.98 | 0.53 | -17.1% |
Read the last row against the first: dropping the filter barely moved the return and nearly doubled the pain. And read the column that matters — every out-of-sample number is positive. This is a living edge, just a modest and crowded one.
Lab notes
I went in expecting to write a "the edge migrated to intraday" piece — daily dead, faster timeframes alive. The data refused to cooperate: daily was fine (0.56), and when I reproduced Connors' TPS scale-in myself, half-expecting the classic in-sample mirage, it came back at 0.78 out-of-sample. Nothing I could build in the RSI(2) family was actually dead. That's the honest finding, and it's a more useful one — the reason this strategy gets waved away isn't decay, it's that everyone (me included) already owns three versions of it. "Dead" and "redundant" look identical on a rejection list and are completely different things.
Download the free strategy report
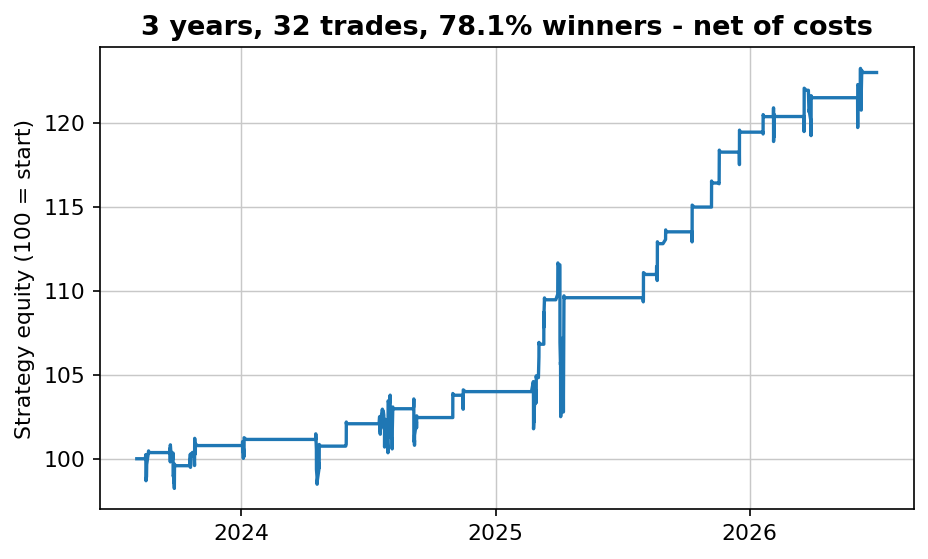
Simple and robust — 70% winners across 155 trades over 16 years, net of costs. The free PDF gives you the market, the timeframe and the exact rules in plain English, plus every single trade it has taken.
Instant delivery. One PDF, no spam. Unsubscribe anytime.
FAQ
What are the rules of the Larry Connors RSI 2 strategy tested here?
Daily version: buy when the 2-period RSI closes below 10 while price is above its 200-day average, and sell when the RSI(2) closes back above 70. Out-of-sample (2018–2026) it earned a Sharpe of 0.56 on Nasdaq futures, net of costs. Connors published several variants; this is the one this article tests.
Is Connors' RSI(2) strategy dead?
No. On 16 years of Nasdaq futures, buying oversold RSI dips (RSI below 10, above the 200-day trend) earned an out-of-sample Sharpe of 0.56 on daily bars, 0.63 on 2-hour and 0.72 on 4-hour, net of costs — and even Connors' elaborate TPS scale-in earned 0.78. When people call RSI(2) "dead" they usually mean it no longer beats a saturated market on its own, or they tested it without a trend filter and met its drawdowns.
Does RSI(2) work on intraday timeframes?
Yes. A 3-period RSI oversold rule on 2-hour and 4-hour Nasdaq bars earned out-of-sample Sharpes of 0.63 and 0.72 — comparable to daily. But the three timeframes correlate 0.5 to 0.76: they're essentially the same trade at different resolutions, so running all three doesn't diversify a book.
Does the 200-day moving average filter improve RSI(2)?
Mostly by cutting risk, not lifting return. Adding it reduced the out-of-sample max drawdown by roughly a third (from about -17% to about -11%) across timeframes, while barely changing the Sharpe. It's a drawdown tool, not a return booster.
Should I trade Connors' RSI(2)?
It's a real but modest and heavily-crowded edge — fine as one mean-reversion sleeve, not a standalone system. Because every timeframe is the same trade and it overlaps almost every other equity-index dip-buying strategy, its value comes from combining it with genuinely uncorrelated strategies, not from running more versions of RSI.

Robin Eriksson
Founder of EdgeLab. Five years of discretionary losses taught me to test everything — now I publish the strategies that survive. About me →
Related: Almost all of the Nasdaq's return happens while you sleep. Can you trade it? · Buying the dip in QQQ: 23 years of evidence, net of costs · The RSI 30/40 strategy: buy the Nasdaq at 30, sell at 40 — every trade from 23 years