The short version: the 200-day moving average is a drawdown tool, not a return booster. Used as a hold-or-cash filter on the S&P 500 it cut the worst drawdown from -55% to -29% and raised the Sharpe ratio (0.64 → 0.72), while giving up some return (10.8% → 8.3% a year). Same story on the Nasdaq and bitcoin. But it is not universal: on gold it lowered risk-adjusted return, and on long-term bonds it turned +3.1% a year into -0.2% while barely touching the drawdown. The rule works on assets that trend and crash hard, and backfires on choppy ones. Here's exactly where the line is.
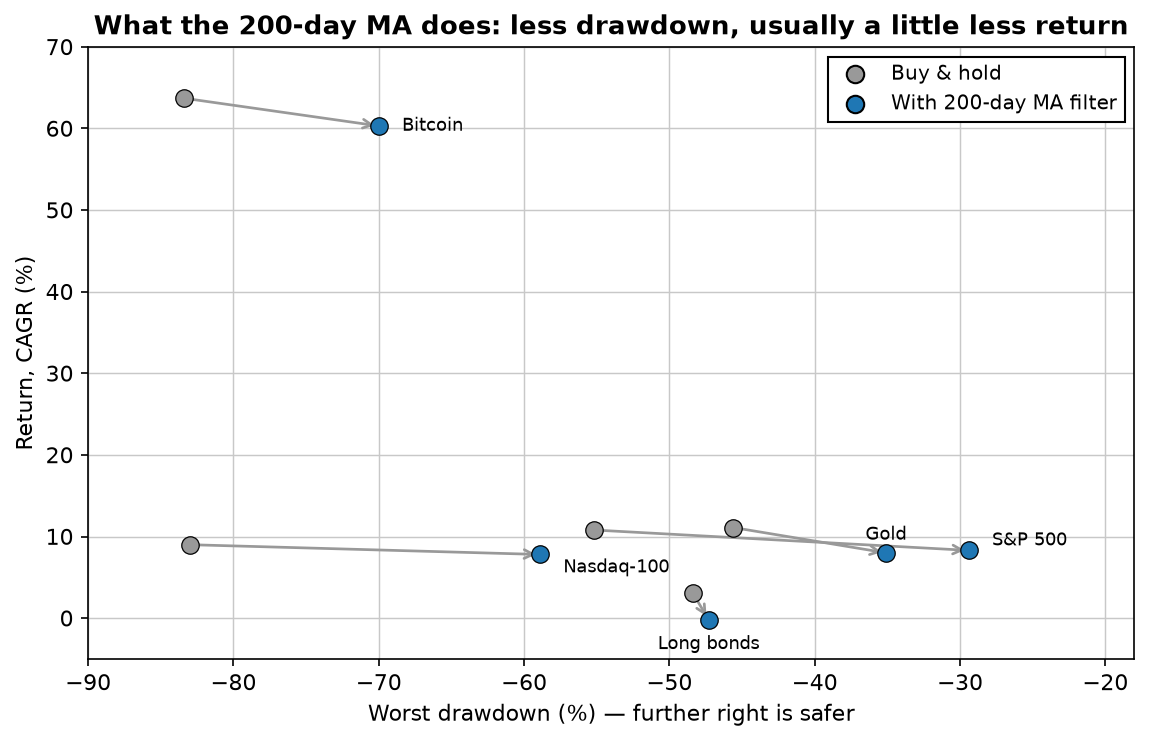
The rule we're testing is the simplest possible version, the one everyone means: at each close, if the price is above its 200-day simple moving average, hold the asset; if it's below, sit in cash. Signals act on the next day (no peeking), and every switch pays 0.05%. One chart captures the entire result — each asset's buy-and-hold point, and where the filter moved it:
On stocks, it does exactly what it promises
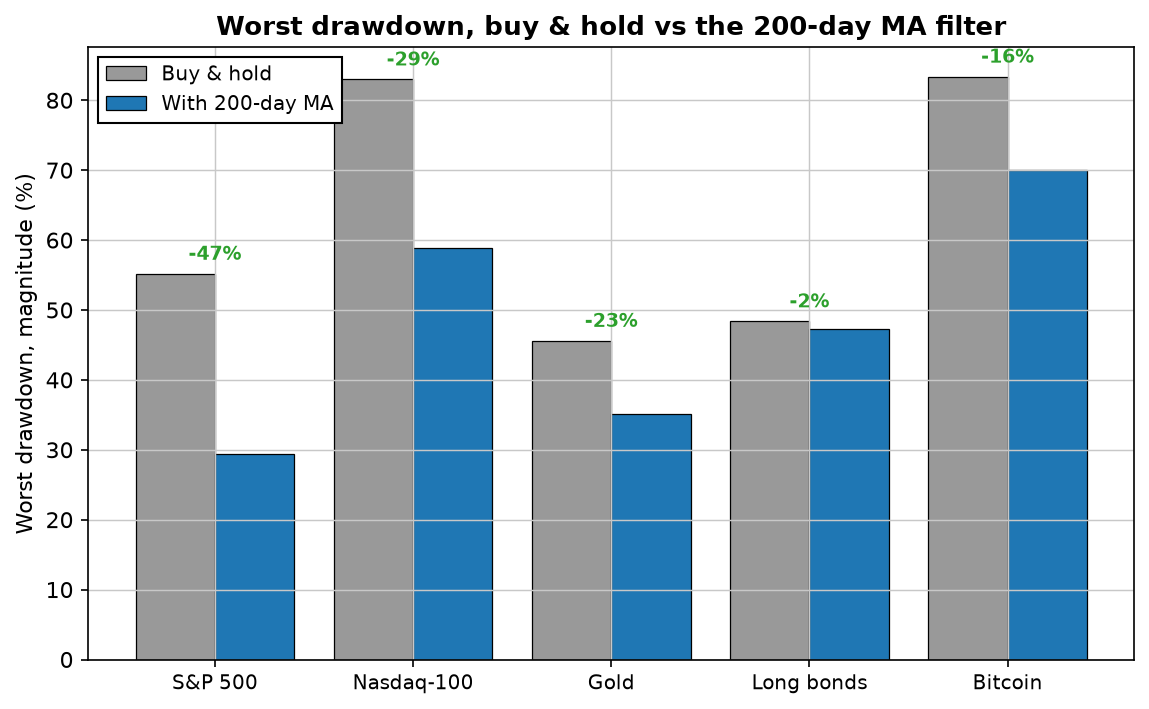
This is the case the 200-day MA is famous for, and it holds up. On the S&P 500 across 33 years, the filter kept you out of the worst of 2000–02, 2008 and 2022, cutting the worst drawdown almost in half. You gave up some compounding — 8.3% a year instead of 10.8% — but per unit of risk you came out ahead: the Sharpe ratio rose from 0.64 to 0.72. The Nasdaq told the same story, turning an brutal -83% buy-and-hold drawdown into -59%.
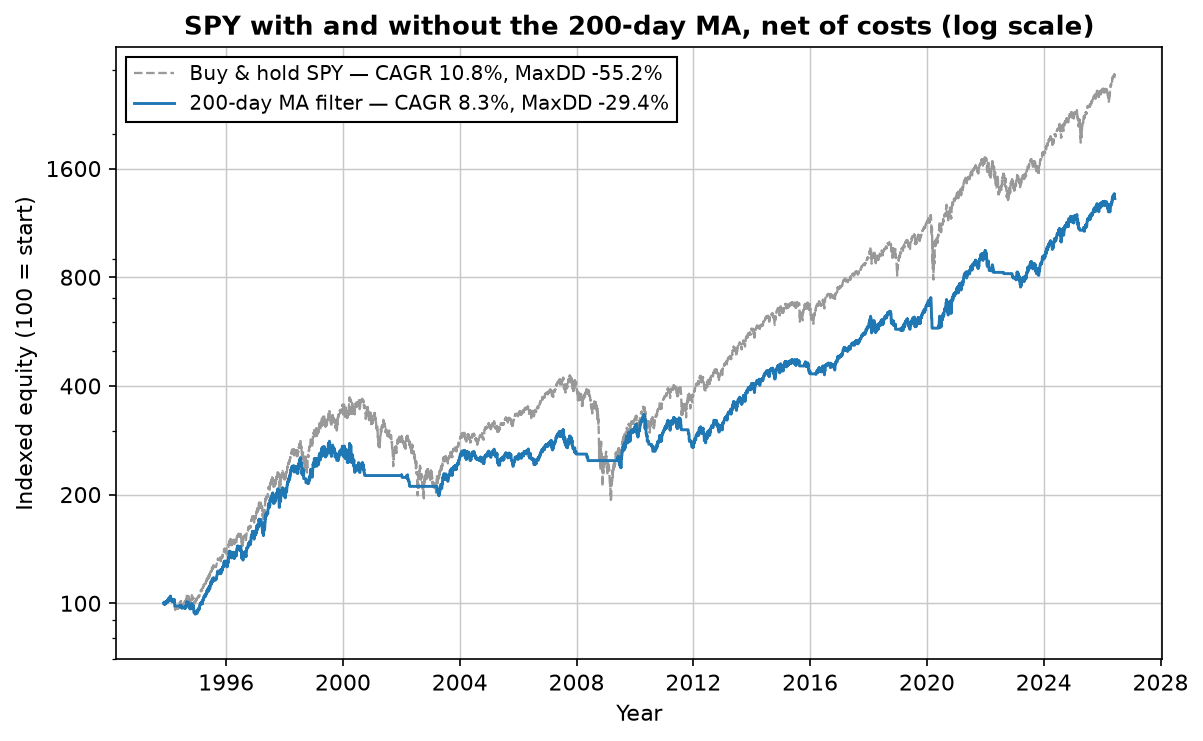
That's the honest trade the 200-day MA offers on a trending, crash-prone asset: a smoother ride for a slice of the upside. Whether that's a good deal depends entirely on you — a buy-and-hold investor who never panic-sells doesn't need it, but most people are not that investor, and a -29% drawdown is a lot easier to hold through than a -55% one. The filter's real product isn't return; it's the ability to still be in the game after a crash.
The reduction is real — and it's biggest where it's needed most
Where it backfires: bonds and, quietly, gold
Now the part most "200-day MA" articles leave out. The filter does not work on everything, and the failures are instructive. Long-term Treasuries (TLT) don't trend cleanly through their 200-day line — they chop sideways around it, which is the exact condition that whipsaws a moving-average filter. The result: buy-and-hold's modest +3.1% a year became -0.2%, and the drawdown barely improved. You paid, in false signals, for insurance that never paid out.
Gold is subtler. The filter cut its drawdown (-46% to -35%), which looks like a win — but the Sharpe ratio actually fell (0.67 to 0.58), because gold's big up-moves often start from below the 200-day line, so the filter was in cash for some of the best runs. The lesson generalises: the 200-day MA only earns its keep on assets that make large, sustained directional moves. On assets that mean-revert or grind, it's a cost with no matching benefit — the same reason a real seasonal pattern isn't always a tradable one.
How to actually use it
- Treat it as risk control, not alpha. If you're deciding whether to be invested in a volatile, crash-prone asset (equities, bitcoin), the 200-day MA is a reasonable, cheap, well-behaved way to cut the tail — knowing you'll give up some upside.
- Don't apply it blindly across assets. It helped stocks and bitcoin, was neutral-to-negative on gold, and was actively harmful on bonds. A rule that works on one asset can be poison on another — always re-test on the specific thing you'll trade.
- Expect to underperform in a long bull market. The filter's whole job is to be in cash sometimes; in a decade without a real crash, that just looks like lagging. That's not the rule breaking — it's the premium you're paying. The same logic runs through the portfolio math: risk reduction has a price, and the point is that it's usually worth it.
Lab notes
I lagged the signal by a day on purpose — position today is based on yesterday's close versus the average — because the sloppy version (trade on the same close you measure) quietly assumes you can act on a price you don't have yet, and it flatters the results by a surprising amount. It's the single most common lookahead bug I see in moving-average backtests, and it's why our strategy graveyard has a metals strategy in it that looked spectacular until I found exactly this mistake. Bonds and gold started in 2003 and 2005 (when the ETFs did); bitcoin from 2015. Different windows, same rule, no parameter tuning — the point was to see where the classic setting holds, not to optimise it.
Download a free strategy
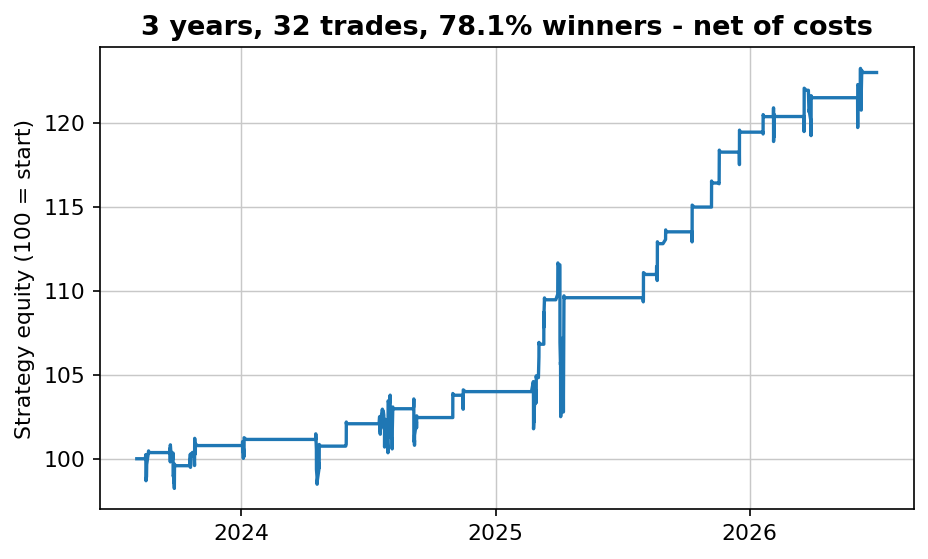
Simple and robust — 70% winners across 155 trades over 16 years, net of costs. The free PDF gives you the market, the timeframe and the exact rules in plain English, plus every single trade it has taken.
Instant delivery. One PDF, no spam. Unsubscribe anytime.
FAQ
Does the 200-day moving average strategy work?
On trending, crash-prone assets, yes — as risk control. On SPY it cut the worst drawdown from -55% to -29% and raised the Sharpe (0.64→0.72), for a bit less return (10.8%→8.3%). Same on Nasdaq and bitcoin. But it lowered gold's Sharpe and turned bonds' +3.1% into -0.2%.
Does it increase returns?
Usually not — it gives up raw return because it sits in cash and re-enters after the bottom. What it improves is drawdown and risk-adjusted return. It's insurance you pay for in return, not a way to make more.
Why does it fail on bonds?
Long bonds (TLT) chop around their 200-day line instead of trending through it, so the filter gets whipsawed at a loss — +3.1% became -0.2% with almost no drawdown benefit. The rule only helps assets that make big, sustained moves.
200-day or 200-week?
Different jobs. The 200-day (~10 months) is a medium-term filter that sidesteps bear markets; the 200-week is a slow structural line that rarely triggers. For hold-or-cash timing, the 200-day is the standard worth knowing.

Robin Eriksson
Founder of EdgeLab. Five years of discretionary losses taught me to test everything — now I publish the strategies that survive. About me →
Related: Your worst drawdown is still ahead of you: 10,000 Monte Carlo reshuffles · When is a strategy dead? Three statistical tripwires we use · The Strategy Graveyard: we stress-tested 150+ trading strategies — most didn't survive