The short version: most paid trading strategies are not worth it — but a minority genuinely are, and you can tell them apart before paying. Demand five things: results net of realistic costs, out-of-sample proof, parameter sensitivity, the losing years on display, and a real sample size. A vendor who can't produce all five isn't selling an edge. They're selling a feeling.
Why would anyone sell a working strategy?
It's the obvious objection, so let's take it seriously. The cynical answer is real: selling strategies is easier than trading them, and plenty of vendors earn more from subscriptions than they ever did from markets. If a sales page shows no live verification and no losing periods, you're probably looking at that business model.
But the honest answer also exists, and it has three parts. Capacity: a daily-timeframe strategy on liquid ETFs doesn't get worse because a few hundred more people trade it — this isn't high-frequency arbitrage where the edge is a finite pie. Income smoothing: trading income is lumpy and drawdowns are part of the job; research income isn't correlated with either. And the work itself: what you're actually paying a serious vendor for isn't a secret formula — it's hundreds of hours of testing you'd otherwise do yourself, plus the discipline of rules that survived that testing.
So the question isn't "why is it for sale?" It's "can I verify the testing happened?" Which brings us to the chart.
One chart explains most bad purchases
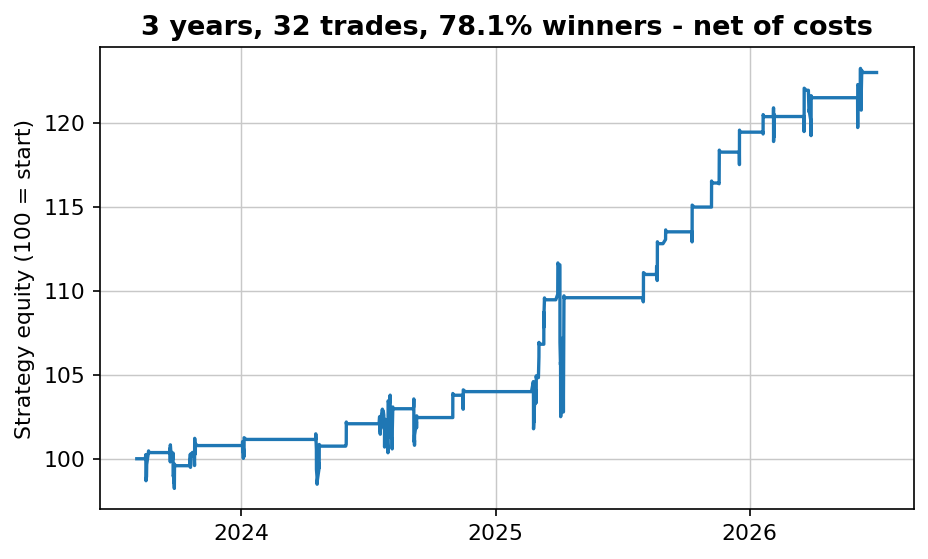
This is a real edge — short-term dip buying on QQQ, about 29 trades a year, the same family of effect our own first free strategy exploits. Nothing fake about it. Now watch what the cost assumption does:
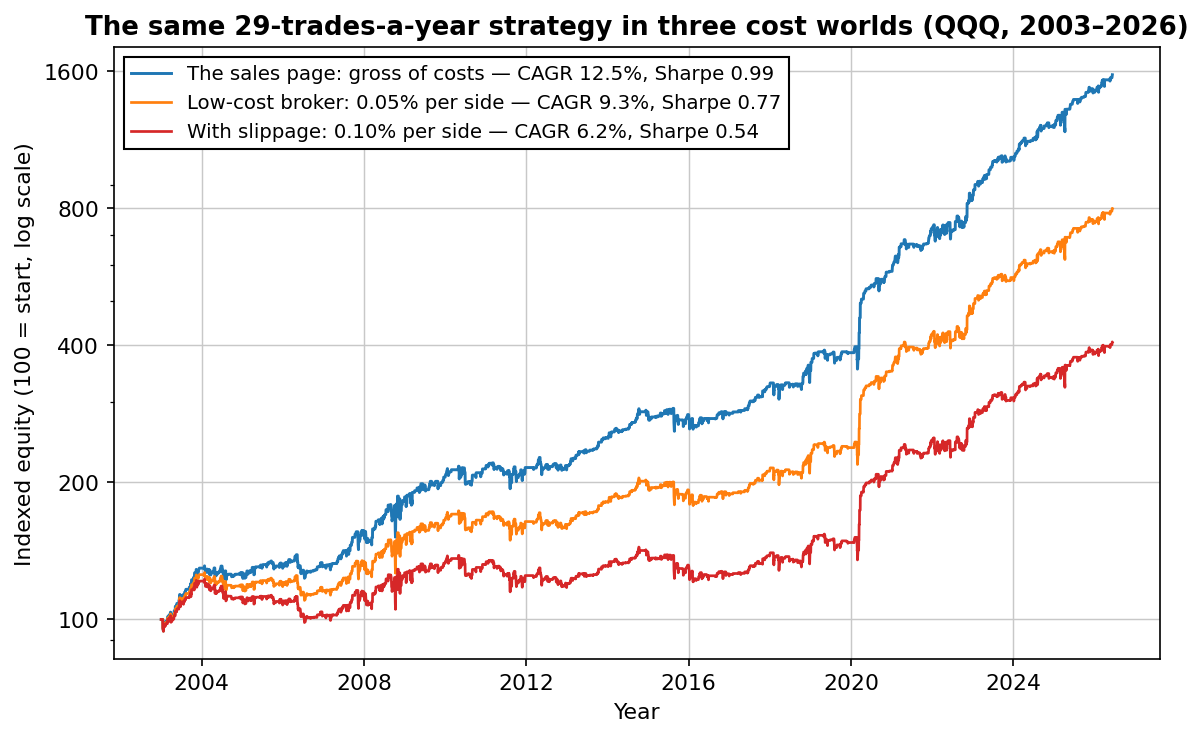
Gross of costs: 12.5% a year, Sharpe 0.99. At a realistic 0.05% per side: 9.3%. With slippage taking it to 0.10% per side: 6.2%, and the Sharpe has nearly halved. The strategy didn't change. The honesty of the presentation did.
And this was a real edge. A curve-fit strategy — one tuned until the backtest looked perfect — doesn't shrink when costs and fresh data arrive. It dies. We ran that experiment separately: 2,160 parameter combinations, and the best one collapsed from Sharpe 0.82 to 0.33 on unseen data.
The five questions
1. "Are these results net of costs — and which costs?"
Not "do you account for commissions" — get the number. Per side or per round trip, and is slippage in it? Then do the arithmetic yourself: trades per year × cost per round trip = annual drag. It's brutal at high frequencies:
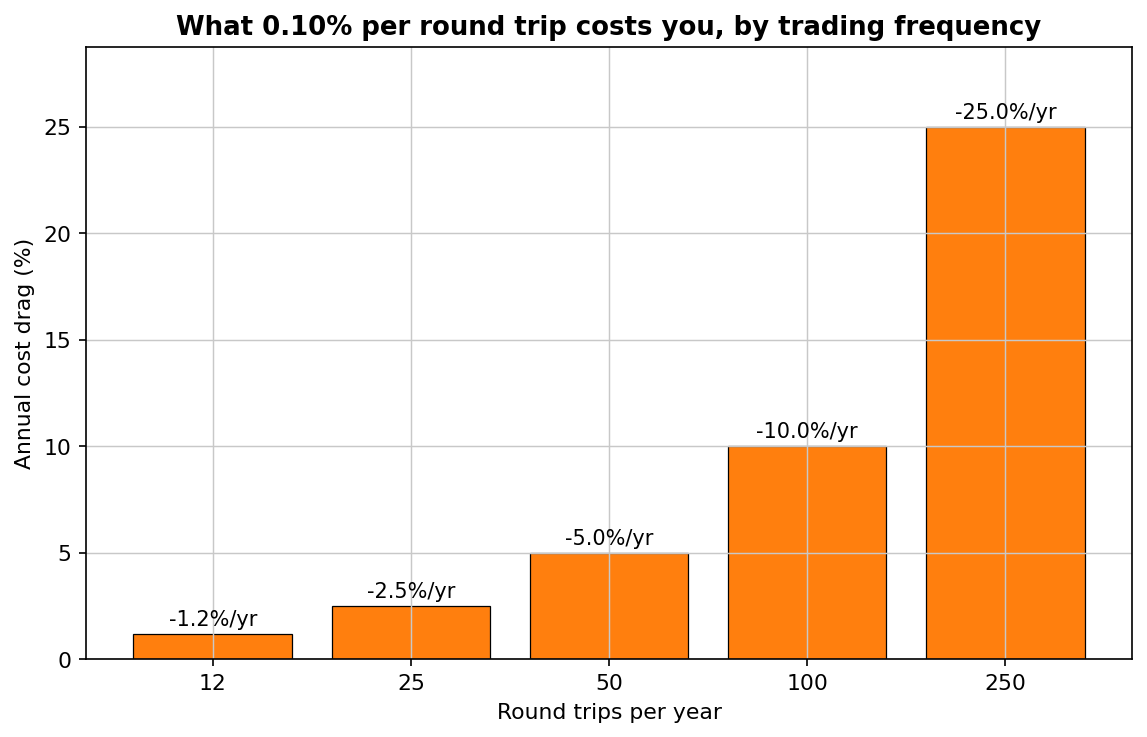
Every backtest we publish charges 0.05% per side — deliberately above what a liquid ETF costs to trade — because we'd rather kill a marginal strategy ourselves than let your broker do it.
2. "What did the strategy do on data it was never tuned on?"
The only part of a backtest that predicts anything is the part the developer couldn't touch. If there's no out-of-sample period — a chunk of history locked away during development and used once — then the entire track record is description, not evidence. This is the single most important question on the list, and the full reasoning (with a worked example) is in our out-of-sample article.
Live track records are even better, with one catch: they need length. Six months of live results is twelve coin flips for a weekly strategy.
3. "What happens if I change the parameters a little?"
Ask what the results look like with the lookback at 15 and 25 instead of 20. A real effect is a plateau: nearby settings give similar results. A curve-fit is a needle: one magic combination, surrounded by losses. Vendors who quote one parameter set and no neighborhood either didn't check — or did.
You can see what an honest plateau looks like in our Friday gold test: VIX thresholds of 18, 20 and 22 all tell the same story, and we say so in the report.
4. "Show me the losing years."
Every real strategy has them. Our own gold trend strategy lost money for roughly seven years straight from 2012 — and we publish that table everywhere, because anyone who trades it without knowing that will quit at exactly the wrong moment. A vendor who shows you 2020–2026 on an equity strategy is showing you a bull market, not a strategy.
The question has a second layer: when does it lose? If the answer is "exactly when stocks crash," the strategy is hidden beta and you could have bought an index fund. The honest version of this analysis sometimes kills a beautiful backtest — it's what killed our ETF rotation strategy.
5. "How many trades is this based on?"
Below a couple of hundred trades, a backtest is an anecdote. And even with enough trades, the specific order they happened in was luck — so ask whether the worst drawdown survives reshuffling. We run Monte Carlo simulations (thousands of randomized trade orders) on every published strategy, and the honest finding is consistent: the historical max drawdown is usually close to the median random path, not the worst one. Whatever drawdown the sales page shows, plan for meaningfully worse.
Red flags that end the conversation
- Win rate as the headline. 90%+ win rates are easy to manufacture: sell options, average down, hold losers. The losses are rare and ruinous. Expectancy per trade is the number that matters.
- Screenshots instead of rules. A broker statement proves somebody made money once — not that rules exist, or that they produced it.
- "Works on all markets and all timeframes." Real edges have a domain. When we tested our gold strategy's logic on silver, it failed — so the report says so, with the numbers.
- Signals without rules. If you can't see the logic, you can't verify anything above, and you're renting a dependency, not buying an asset.
- Countdown timers and "3 spots left." Evidence doesn't expire on Friday.
What a fair deal actually looks like
After all that, here's the positive version. A strategy purchase is defensible when you're paying for verifiable testing work: complete rules in plain English (so you can run them on any platform, audit every claim, and never depend on the seller again), backtests net of stated costs, out-of-sample results, sensitivity tables, Monte Carlo stress tests, and the losing periods in plain sight. That's a research product. It either survives your checking or it doesn't — which is precisely the point.
If the vendor passes all five questions, the price is rarely the problem. Hundreds of hours of honest testing is worth more than most traders lose in their first month of improvising.
See what the standard looks like — free
Our free strategy report is built to pass this exact checklist: plain-English rules, costs included, every trade on display — winners and losers. Judge the format before anyone asks you to pay for anything.
No spam. Unsubscribe anytime.
FAQ
Are paid trading strategies worth it?
Most aren't; a minority are. The difference is checkable before paying: costs included, out-of-sample proof, parameter plateaus, losing years shown, real sample size. No vendor who has done the work refuses to show it.
How do I verify a strategy before buying?
Ask the five questions in this article. Any "no", any dodge, any "proprietary" in response to a question about testing methodology (not the rules themselves) is disqualifying.
What's the single biggest red flag?
Equity curves gross of trading costs. It's the most common, the easiest to check, and as the first chart shows, it can be the entire difference between the strategy you bought and the one you get.
Should I just build my own instead?
You'll learn more building — and everything on this site is meant to help with that. Buying is rational only when it's auditable research you're too time-constrained to reproduce, never when it's a black box.

Robin Eriksson
Founder of EdgeLab. Five years of discretionary losses taught me to test everything — now I publish the strategies that survive. About me →
Related: The Friday gold effect: a real pattern you probably can't trade · Is the opening range breakout dead? We tested it on the Nasdaq · Zarattini's intraday momentum on the Nasdaq: the long side survives, the short side is a mirage