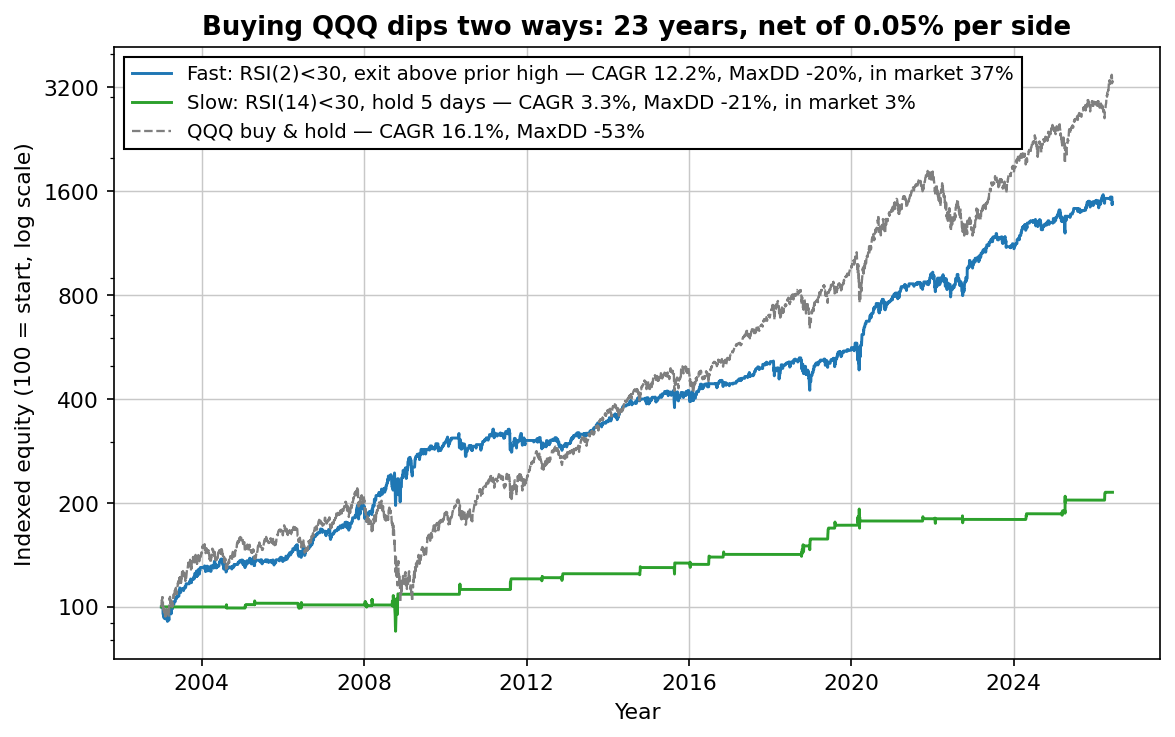
The short version: dip buying on QQQ is real and robust. Nearly every oversold-threshold and holding-period combination we tested was profitable net of costs — a plateau, not a lucky setting. A simple fast version earned 12.2% a year with a -20% worst drawdown while in the market 37% of the time (buy & hold: 16.1% with -53%). It doesn't beat buy and hold on raw return — its case is earning most of the return with a fraction of the exposure and pain.
What counts as a dip? Test the whole grid
The biggest sin in strategy articles is picking one parameter set and declaring victory. So here's the entire grid: buy QQQ at the close when 14-day RSI is below a threshold, sell after a fixed number of days, 0.05% commission per side, 2003–2026. Twenty combinations, no cherry-picking:
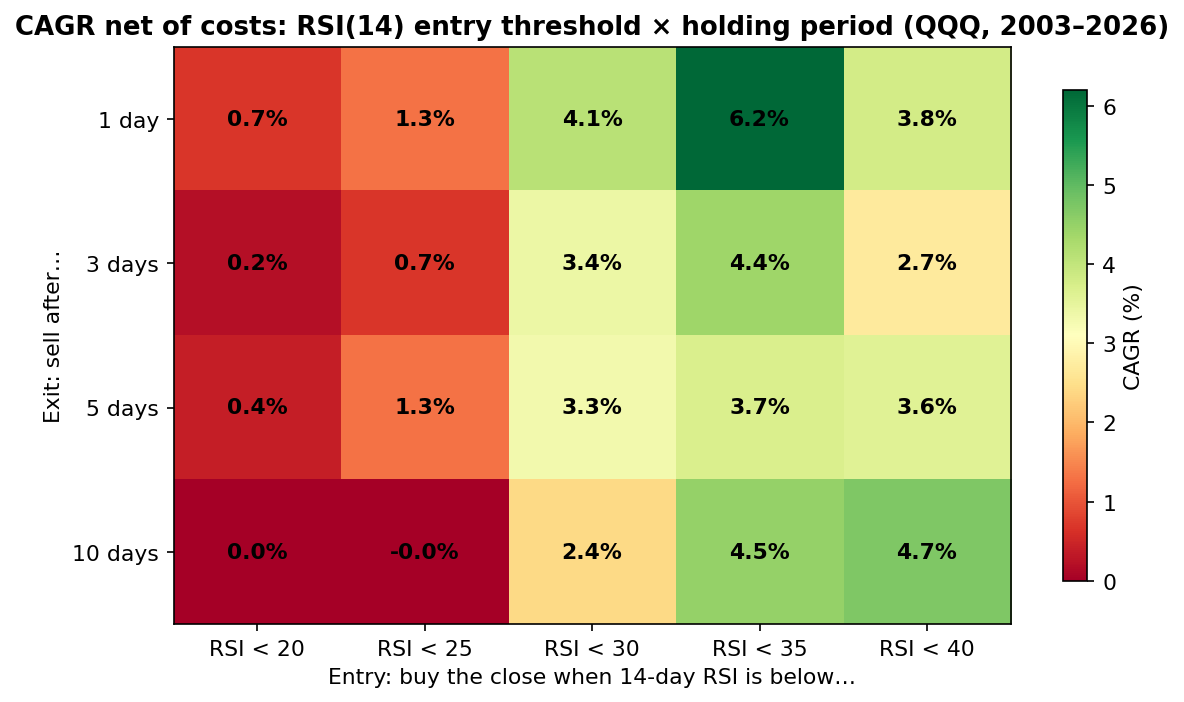
Two things to take from the colors. First, the plateau: thresholds 30 through 40 are profitable at every holding period. When an effect survives across a neighborhood of settings, it's much more likely to be real — this is the exact test we tell you to demand from anyone selling you a strategy. Second, the percentages look small because exposure is small: the RSI<30, 5-day version is in the market 3% of all days. Earning 3.3% a year from 8 days a year of market exposure is a remarkably high return per day of risk — it just doesn't compound into a big headline number.
The two honest versions
From the grid, two sensible strategies emerge — a fast one and a slow one. The fast one uses 2-period RSI (the indicator Larry Connors built his mean-reversion research around): buy the close when RSI(2) is below 30, exit when the close exceeds the previous day's high, 10-day failsafe. The slow one is the crisis sniper: RSI(14) below 30, hold five days, which only triggers in genuine panics.
| Metric | Fast: RSI(2)<30 | Slow: RSI(14)<30, 5d | QQQ buy & hold |
|---|---|---|---|
| CAGR | 12.2% | 3.3% | 16.1% |
| Sharpe ratio | 0.82 | 0.45 | 0.80 |
| Max drawdown | -19.5% | -21.2% | -53.4% |
| Time in market | 37% | 3% | 100% |
| Trades (23 yrs) | 602 | 36 | 0 |
One self-audit before moving on: by our own checklist, the slow version's 36 trades make it an anecdote, not a system — we show it to map the family's structure, not as something to trade standalone. The statistical weight in this article sits in the fast version's 602 trades and the breadth of the heatmap.
The caveat the meme version skips
Look at the table honestly: buy and hold earned more. Dip buying is not a machine for beating the index — over 23 years of a strong bull market, nothing that sits in cash 63% of the time was going to win on raw CAGR. Its case rests on two other columns:
- The worst case is a third of the size. -20% versus -53%. Since your sustainable position size is set by the drawdown you can survive — the argument we make everywhere — a -20% strategy can be sized meaningfully larger than a -53% one, which closes much of the CAGR gap at equal pain.
- 63% of the time, the capital is free. The same account can run an uncorrelated strategy in another market with no competition for capital — and the combination math is where systematic trading gets genuinely attractive.
And the second caveat: this works on diversified indices, not on everything. A stock index can't go to zero and mean-reverts because panic overshoots; a single stock can simply be correctly repriced. Dip buying individual names is a different (and much worse-behaved) bet.
Has it decayed?
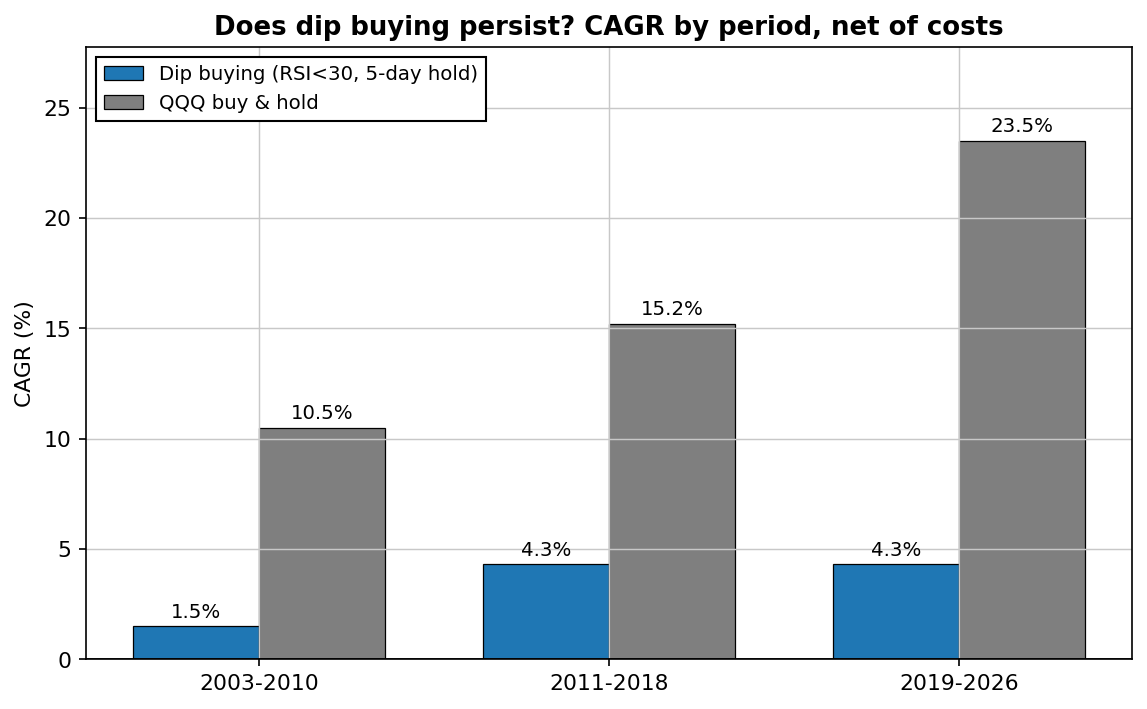
This persistence is the strongest argument that index mean reversion reflects something structural about how fear works, rather than a quirk that got arbitraged away once published. It's also why this family is where we built our own flagship strategy.
From public version to tested system
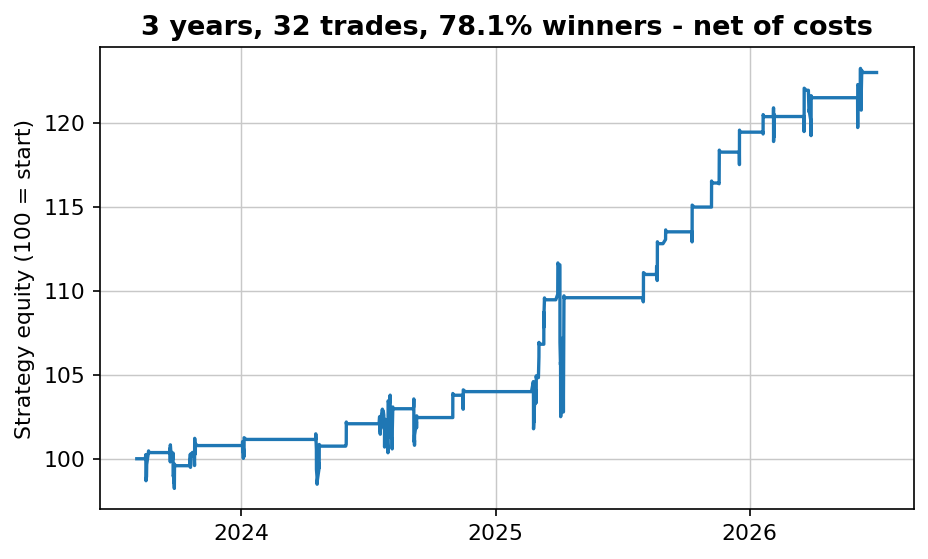
Everything above is the public, classic version of the idea — and you're welcome to trade it exactly as written; the rules are all on this page. Our free subscriber report is what happened when we took this family and did the boring work: tested 19 modifications, kept the one that survived out-of-sample validation (Sharpe above 1 on data it was never tuned on), and wrote up the sensitivity tables and Monte Carlo drawdowns. Same engine, tighter filters, fully documented.
Download the free strategy
The free strategy report comes from this exact family: my video walkthrough, every trade it has taken, a faster variant and what both honestly earn — the market, the timeframe and the exact rules, in plain English.
No spam. Unsubscribe anytime.
FAQ
Does buying the dip work on QQQ?
Yes — profitably and robustly across nearly every threshold/holding combination we tested, net of costs. The fast version earned 12.2% a year with a -20% worst drawdown, in the market 37% of days.
Does it beat buy and hold?
Not on raw return (12.2% vs 16.1%). It wins on risk: a third of the exposure, a third of the worst case, similar Sharpe — which is what lets you size it up or pair it with other strategies.
What RSI level should I use?
Anywhere on the plateau works: RSI(14) thresholds 30–40, holds of 1–10 days, or the RSI(2)<30 fast variant. Distrust anyone who insists the edge needs one exact number — ours didn't, and that's the point.
Does this work on individual stocks?
Treat that as a different, riskier bet. Indices mean-revert because diversified panic overshoots; a single company's crash is often just new information being priced correctly.

Robin Eriksson
Founder of EdgeLab. Five years of discretionary losses taught me to test everything — now I publish the strategies that survive. About me →
Related: The RSI 30/40 strategy: buy the Nasdaq at 30, sell at 40 — every trade from 23 years · Does Connors' RSI(2) still work? We tested it on the Nasdaq · The Turnaround Tuesday strategy — rules and 23 years of backtest data