The short version: fading the VWAP bands, the textbook mean-reversion VWAP trading strategy, lost money in all 17 years, with an out-of-sample Sharpe of -2.64 after costs. It loses on average even before costs. The trend rule, five one-minute closes on one side of VWAP, cleared the failure line I registered in advance: out-of-sample Sharpe 0.48 against a bar of 0.3. So there is a measurable signal in being on the right side of VWAP: before costs, the trend rule made money in 13 of 17 years. And one honest catch: it lives on about 1.5 basis points per trade before costs, three years made most of its money, and it has lost in every year since 2023.
VWAP is one line on the chart, and I fixed two rules around it before the run
VWAP, the volume-weighted average price, is the average price of everything traded in the session so far, with each trade weighted by its size. Institutional desks use session VWAP as a benchmark: an order filled below the day's VWAP was a good buy. Retail traders turned it into a signal, and the common textbook forms are the two I tested. I wrote them down on 2026-10-15, before any of this was run:
- VWAP: starts fresh at 09:30 New York time. On each one-minute bar, the running sum of typical price (high + low + close, divided by three) times volume, divided by the running volume.
- Rule A, trend: from 10:00, go long after five consecutive one-minute closes above VWAP, short after five below. The opposite signal closes the trade and reverses it. Flat at 15:55.
- Rule B, reversion: when a one-minute close is more than 2 standard deviations above VWAP, go short; more than 2 below, go long. Target: back at VWAP. Stop: 3 standard deviations. Flat at 15:55. The standard deviation is the volume-weighted spread of prices around VWAP since the open, the same way VWAP bands are drawn on most platforms. That is my reading of "standard deviations of price minus VWAP" in the rules I wrote down, which left the exact formula open. Target and stop move with VWAP and the bands, as of the previous bar's close.
Every entry, and every exit on a signal or at 15:55, happens at the open of the next one-minute bar, so no trade uses a price it could not have got. Rule B's target and stop fill at their level inside the bar, or at the open if the bar opens beyond it, and if a stop and a target are both inside one bar, the stop counts. Costs are 0.01% of price per round trip, the level we used for NQ in the opening range breakout and Zarattini articles; I come back to whether that is fair, because for one of these rules it decides everything. June 2010 to December 2017 is in-sample, January 2018 to April 2026 out-of-sample. The failure line: if the out-of-sample Sharpe is below 0.3 for both rules, the verdict is that VWAP carries no tradeable signal on NQ. All positions close by 15:55, so the contract switches in our continuous futures series, which happen in the evening, never touch a trade. Here is what the two rules look like on one real day.
One wild afternoon shows how each rule thinks
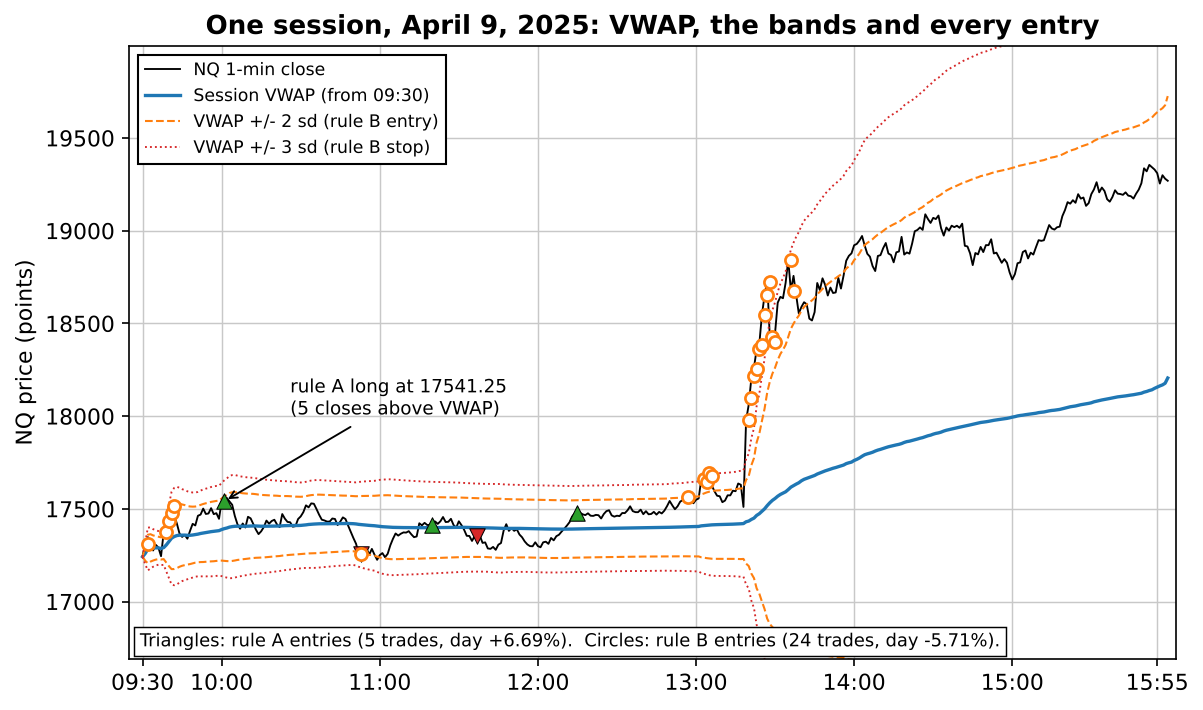
Study the cluster of orange circles after 13:00 first. Every one of them is rule B selling a move that was more than 2 standard deviations above VWAP, and every one assumed the move would come back. It didn't. Of B's 24 trades that day, 21 ended at the stop and 2 at the target, for -5.71% at 1x notional. 11 of them were stopped at the very price they were entered: the market had moved so far in one minute that the next bar already opened beyond the 3-standard-deviation stop. Rule A did the opposite. It went long at 10:01, after five closes above VWAP, lost on that trade and the next three as price chopped back and forth across the line, then went long again at 12:15 and held through the whole rally, for +6.69% on 5 trades. One day proves nothing, which is why the rest of this article is about the other 4,045 sessions. But it shows the structural problem of the fade: its stop is the same distance away whether the day is quiet or historic. The full record of the fade comes first.
Fading the VWAP bands loses money in every single year
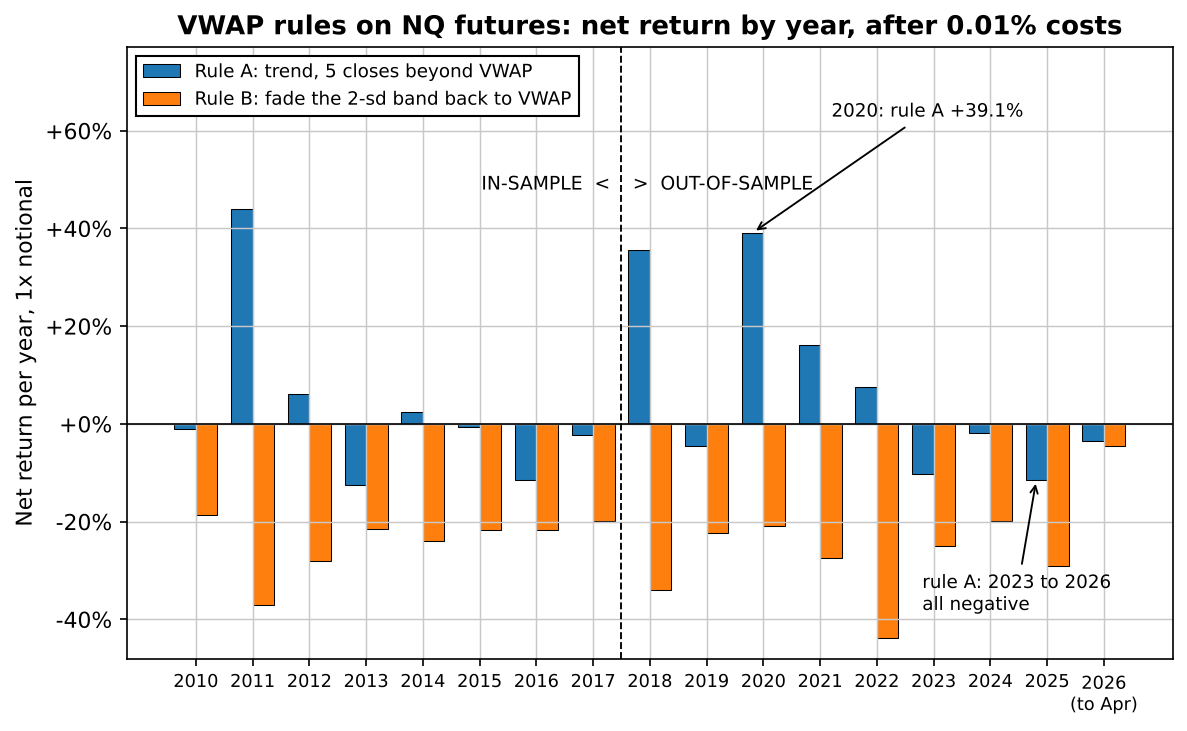
Rule B is the VWAP strategy often taught as the patient one: price is "stretched", so bet on the snap-back. Over 32,437 trades it lost money in 17 of 17 years after costs, and in 16 of 17 before them; the one exception, 2024, made +2.0% before costs and -19.8% after. It traded about 8 times a session, and 66.6% of its out-of-sample trades ended at the stop, against 26.6% at the VWAP target. Being stretched by 2 standard deviations on a one-minute chart of the Nasdaq is not rare enough to mean exhausted:
| Net of 0.01% round trip | A in-sample 2010–2017 | A out-of-sample 2018–2026 | B in-sample | B out-of-sample |
|---|---|---|---|---|
| Trades | 7,943 | 8,811 | 15,373 | 17,064 |
| Trades per session | 4.14 | 4.14 | 8.01 | 8.03 |
| Win rate | 26.6% | 26.8% | 27.1% | 26.2% |
| Average trade, before costs | +1.25 bp | +1.73 bp | -0.43 bp | -0.54 bp |
| Average trade, net | +0.25 bp | +0.73 bp | -1.43 bp | -1.54 bp |
| Median trade, net | -8.16 bp | -10.26 bp | -1.53 bp | -1.63 bp |
| Profit factor | 1.02 | 1.05 | 0.76 | 0.80 |
| Total return, 1x notional | +16.6% | +70.1% | -89.2% | -93.3% |
| CAGR | 2.05% | 6.65% | -25.5% | -27.9% |
| Max drawdown | -27.8% | -38.4% | -89.3% | -93.5% |
| Time in market (of the 09:30–16:00 session) | 89.7% | 89.0% | 49.5% | 49.0% |
| Sharpe (daily, annualised) | 0.24 | 0.48 | -3.53 | -2.64 |
A basis point (bp) is 0.01%, so the cost of one round trip here is exactly 1 bp. Rule B's average trade is -0.54 bp out of sample before any cost: the fade is wrong on average, not just too expensive. Costs then turn a small leak into -93.3% at 1x notional. The other pre-registered settings, bands at 1.5, 2.5 and 3 standard deviations, all lose too (the plateau chart below has them). One more thing I checked, explored after the fact: 44.5% of B's out-of-sample entries happened before 10:00, when the bands are still narrow because the session is young. Re-running B with signals allowed only from 10:00, like rule A, still gives an out-of-sample Sharpe of -1.82. The early minutes make it worse; they are not why it fails. The trend rule is a different story, and a less tidy one.
The trend rule clears the line, but three years did most of the work
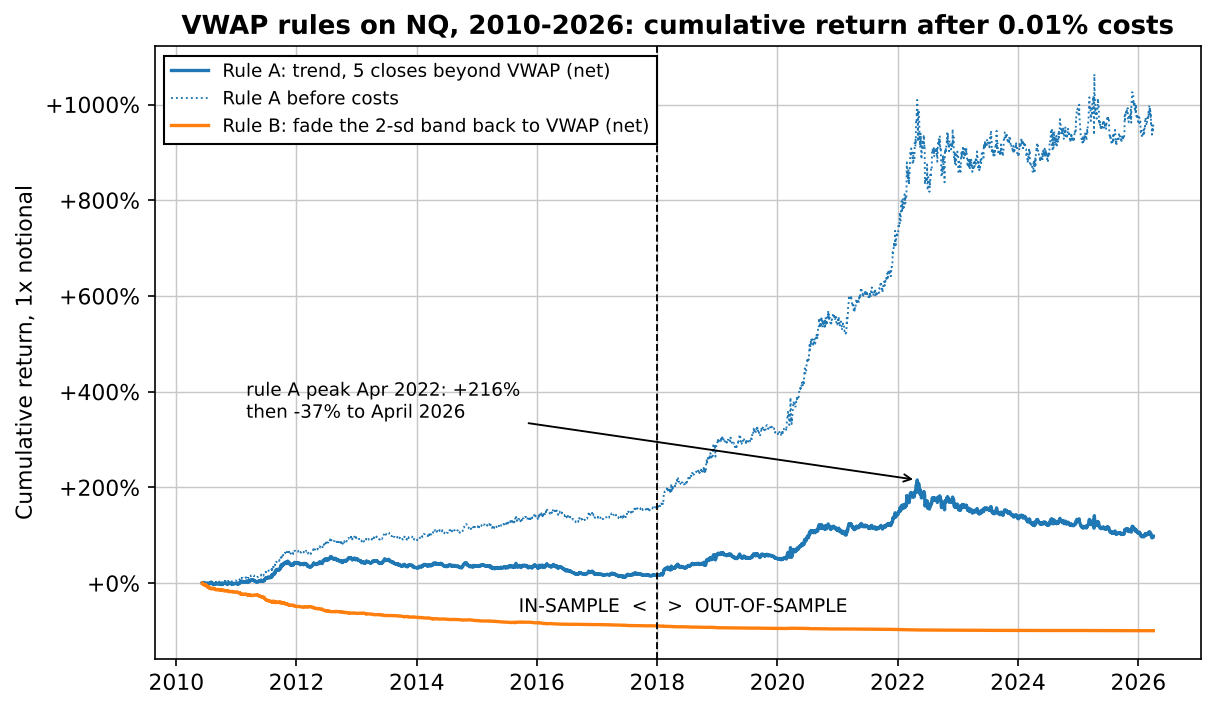
Over the whole period rule A made +98.4% after costs with a Sharpe of 0.38 and a maximum drawdown of -38.4%. Out of sample the Sharpe was 0.48, so it passed the pre-registered line, and the in-sample half (0.24) was below it. The out-of-sample half as a whole was better than the in-sample half, but it is not a smooth edge either. Look at the shape: rule A wins on about one trade in four (26.7%), loses a little on the median trade, and makes its money on the long trend days when it stays in for hours. Those days come in clusters. The year table shows where:
| Year | A trades | A net return | B trades | B net return |
|---|---|---|---|---|
| 2010 (from June) | 604 | -1.0% | 1,074 | -18.6% |
| 2011 | 990 | +43.9% | 2,181 | -37.1% |
| 2012 | 1,024 | +6.2% | 2,085 | -28.1% |
| 2013 | 1,064 | -12.4% | 1,978 | -21.5% |
| 2014 | 991 | +2.4% | 1,926 | -24.0% |
| 2015 | 1,097 | -0.6% | 2,211 | -21.7% |
| 2016 | 1,111 | -11.4% | 2,093 | -21.6% |
| 2017 | 1,062 | -2.3% | 1,825 | -19.9% |
| 2018 | 1,044 | +35.7% | 2,017 | -34.0% |
| 2019 | 1,065 | -4.5% | 2,130 | -22.4% |
| 2020 | 1,103 | +39.1% | 1,926 | -20.9% |
| 2021 | 1,076 | +16.2% | 1,993 | -27.4% |
| 2022 | 1,068 | +7.6% | 2,009 | -43.7% |
| 2023 | 1,101 | -10.2% | 2,202 | -25.0% |
| 2024 | 1,045 | -1.9% | 2,397 | -19.8% |
| 2025 | 1,058 | -11.4% | 1,931 | -29.1% |
| 2026 (to April) | 251 | -3.4% | 459 | -4.6% |
Rule A was positive in 7 of 17 years. 2011, 2018 and 2020 together made more than the whole period did: the other 14 years, compounded, come to -27.0%. Those three were years of violent selloffs and rebounds, the kind of tape where a trend that starts at 10:00 keeps going until the close. Since the April 2022 peak the rule has given back 37.2%, and 2023, 2024, 2025 and the start of 2026 were all negative. Whether that is a quieter regime or the edge decaying, this test can't tell; four losing years in a row is exactly what both would look like. If you trade a VWAP trend rule, this is what waiting for those days looks like. And there is a second problem, which is how thin each trade is.
The whole edge is about one and a half basis points a trade
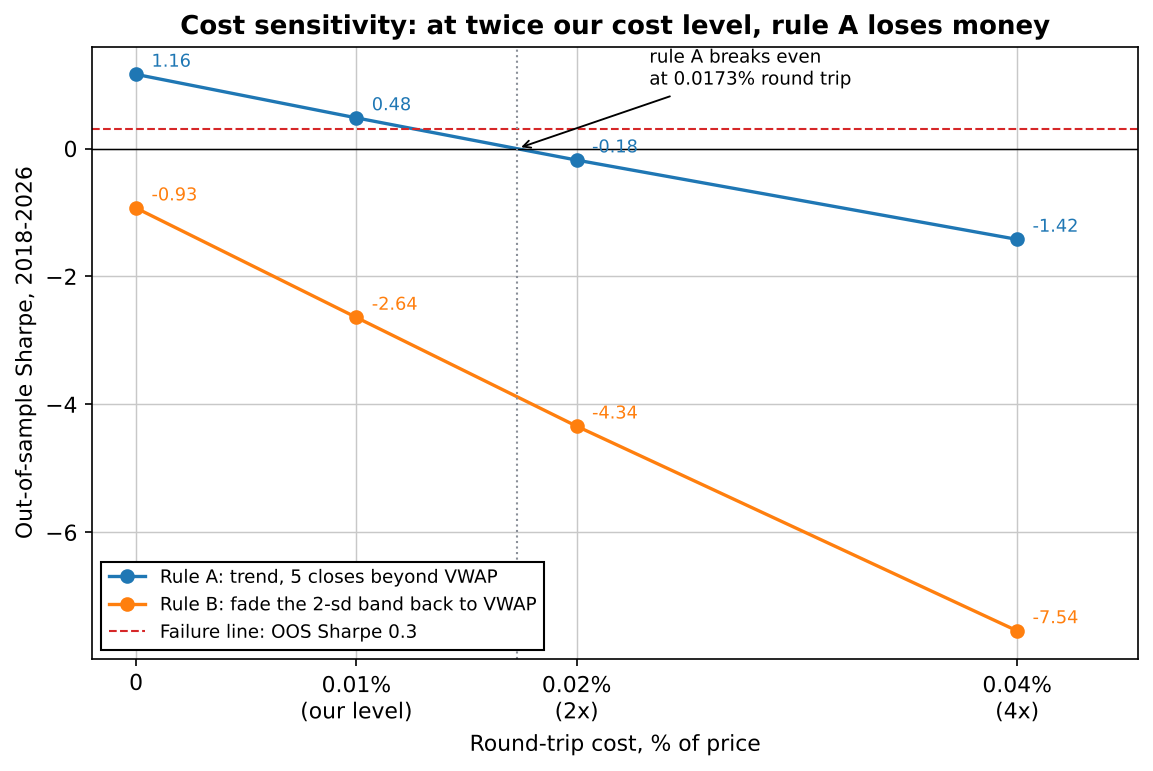
Before costs, rule A is a genuinely good signal: an out-of-sample Sharpe of 1.16, and +959.3% over the whole period at 1x notional. But that is spread over 16,754 trades, about 4 a session. Its average trade before costs was 1.73 bp out of sample and 1.25 bp in-sample, so it breaks even at a round-trip cost of 0.0173% of price. Twice our cost level, 0.02%, and the out-of-sample Sharpe is -0.18.
Is 0.01% fair for NQ? It depends on the year. The smallest price step on NQ is 0.25 points, one tick. In June 2010, at 1,840, one tick was 1.36 bp, and our whole 0.01% cost was 0.18 points, less than one tick. Our 0.01% is meant to be all-in: spread, commission and slippage together, with no separate commission on top. Rule A enters and exits at market, so it pays the spread on both sides; in 2010 that alone was more than our whole cost, so the in-sample net numbers flatter rule A, and its real in-sample result was worse than the table shows. By January 2018, at 6,481, a tick was 0.39 bp, and at the last price in the data, 23,896, it was 0.1 bp, while 0.01% is 2.39 points. So over the out-of-sample years one tick plus a typical retail commission fits inside 0.01%, with little room left for slippage on a fast tape. The edge is real in the sense that it is there before costs in both halves. It is fragile in the sense that a few ticks of extra slippage a day decide whether it exists. The next question is whether the five-close setting was a lucky pick.
The neighbouring settings agree on the direction, not on the size
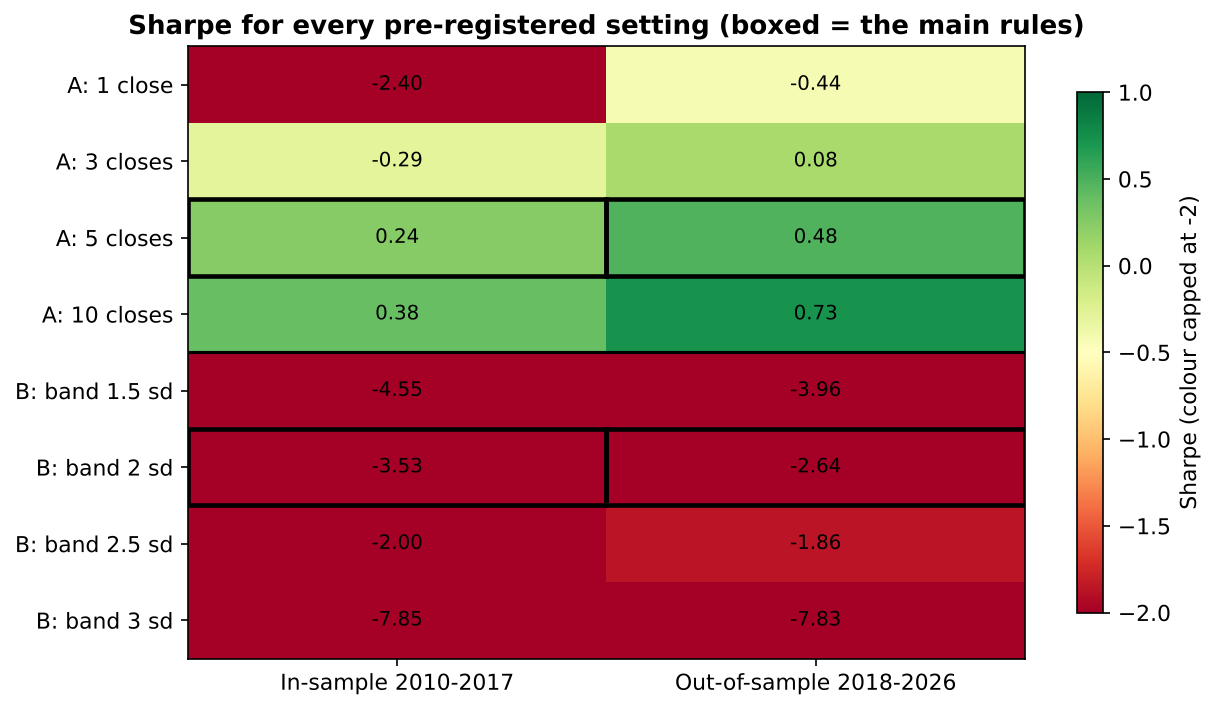
The pre-registration fixed four settings for each rule so I could see whether the result is a plateau or a spike. For rule A it is a slope: one close above VWAP is a coin flip that churns about 12 trades a day and loses badly, three closes is roughly flat, five is positive, ten is better still (0.38 in-sample, 0.73 out of sample). That pattern makes sense, since every extra close of confirmation removes trades that would mostly have paid costs and been reversed. But I registered five as the main rule, and I am not switching to ten after seeing the out-of-sample column. That is the exact move that turns a backtest into a story. For rule B the whole column is red. The 3-standard-deviation band is the strangest cell: it sits exactly on the stop, so nearly every trade was stopped at the next bar's open, with a win rate close to zero. That was a flaw in my pre-registration that I only saw once it ran. The two other choices people ask about are fixes, and there was a list ready for those.
Long only was the one fix that survived, and it didn't beat the original
Every strategy article now runs the same short menu of possible improvements, registered in advance (this run used the version dated 2026-11-08, which added the distance-from-VWAP item): a trend filter, volatility-scaled size, a fixed holding time, an ATR stop, one side only, no trading on Fed days, a calm-market filter, a distance-from-VWAP filter, and a few more. Only items that fit the strategy's style are tried, and the one that combines several markets was skipped, because this test has one market. The selection uses in-sample data only: every bar from 2018 on is deleted before any variant is computed. An item is kept if it raises the in-sample Sharpe by at least 0.10 and beats the base rule in at least 70% of its settings, at most two per rule. Only then are the kept ones run out of sample, with the same costs and the same failure line. 13 items were tried in 35 settings:
| Improvement (in-sample 2010–2017 only) | IS Sharpe | Change vs base | Settings better than base | Kept? |
|---|---|---|---|---|
| Rule A, base | 0.24 | |||
| A: calm market only (80th percentile) | -0.06 | -0.30 | 0% | no |
| A: volatility-scaled size (20 days) | 0.11 | -0.13 | 0% | no |
| A: fixed holding time (10 bars) | -2.88 | -3.12 | 0% | no |
| A: ATR stop (3 x daily ATR) | 0.24 | 0.00 | 0% | no |
| A: long side only | 0.53 | +0.29 | 100% | yes |
| A: skip entries far from VWAP (2.5 x ATR) | -0.39 | -0.63 | 0% | no |
| Rule B, base | -3.53 | |||
| B: trend filter (200-day average) | -2.24 | +1.29 | 100% | yes |
| B: only after fear (VIX above its 20-day average) | -3.18 | +0.35 | 100% | passed, ranked third |
| B: volatility-scaled size (20 days) | -3.77 | -0.24 | 0% | no |
| B: fixed holding time (10 bars) | -3.13 | +0.40 | 67% | no |
| B: ATR stop (3 x daily ATR) | -3.52 | +0.01 | 67% | no |
| B: long side only | -1.86 | +1.67 | 100% | yes |
| B: no trades on FOMC days | -3.59 | -0.06 | 0% | no |
Two things stand out. First, a daily ATR stop changed nothing for rule A, because a stop several days' range away is never reached inside one session. Second, the rule happily "improved" rule B from -3.53 to -1.86, which is a big change and still a strategy that loses money every year. Out of sample, both kept B fixes stayed deep below the line: long-only -1.85, the trend filter -1.92.
For rule A, long only was the one item kept. Out of sample it had a Sharpe of 0.44, above the 0.3 line, so it holds. It did not beat the original (0.48), but it got there with half the trades and a much smaller hole: a maximum drawdown of -13.8% against -38.4% over the full period. Nasdaq has drifted up for most of these 16 years, and the short side of the trend rule mostly paid costs to fight that drift. As written, the VWAP trend rule passes; this change, chosen before we looked, holds too, with a gentler ride and no more return. So what is a VWAP strategy actually good for?
What this means if you use VWAP intraday
This tests two mechanical rules, on one market, with one definition of VWAP. It doesn't test VWAP as an execution benchmark, which is what institutions use it for and where it does its job by definition. It doesn't test discretion: a trader who fades the bands only on quiet, range-bound days, and stays away on days like April 9, 2025, may be doing something these rules can't. What the test does say is clear in one direction. The idea that price "should" come back to VWAP from 2 standard deviations away is wrong on average on the Nasdaq: before costs it lost in 16 of 17 years, after costs in every one. If you trade a VWAP band fade, this is the base rate your judgement has to beat.
The other direction is more interesting. Being on the right side of VWAP carried information on NQ in both halves of the data. But a signal that earns 1.5 bp per trade, about 4 times a day, belongs to whoever has the cheapest execution, and it only paid in years with big intraday trends. That makes it, at best, something to study further, not a finished strategy, and only for someone who knows their costs to the tick. For why a strategy can be real and still spend years under water, see how many strategies you need.
Lab notes
This test was registered on 2026-10-15, rules, settings, split, costs and failure line, and run unattended early on November 10. Two things from the run. The 3-standard-deviation band in rule B's plateau sits exactly on its own 3-standard-deviation stop, so almost every trade in that cell was stopped at the next bar's open: a win rate of 0.4% in-sample, a cell that measures my rule-writing rather than VWAP. I left it in because it was registered, and because it is a good reminder that a pre-registration can contain a mistake you only see in the output. Second, the ATR stop in the improvement menu gave rule A exactly the same in-sample Sharpe, 0.24, at all three widths. Identical numbers smell like a bug, so I checked: a stop two to four days' range from the entry never triggers inside a single session, so the trades were literally the same. Before the PDF code went in, the standalone strategy.py reproduced the main script trade for trade on 2024 to 2026, with the same entries, exits and prices: 2,354 trades for rule A and 4,787 for B.
So, does a VWAP strategy work on Nasdaq futures? Fading it doesn't, in any year after costs. Following it does, a little, in the years that trend, at costs most retail accounts won't get.
Get the VWAP rules + the Python code (PDF)
Every rule from this test on one page, the results table, and standalone Python you can run on your own data. Free, by email.
Instant delivery. One PDF, no spam. Unsubscribe anytime.
FAQ
What is a VWAP strategy?
VWAP is the volume-weighted average price of the session: every trade's price weighted by its volume, accumulated from the open. A VWAP strategy uses price relative to that line as the signal. The two common retail forms are trend (buy while price holds above VWAP, sell short while it holds below) and reversion (fade a stretch far from VWAP, with bands measured in standard deviations, and target a return to VWAP).
Does a VWAP strategy for intraday trading work?
In our test on Nasdaq-100 futures (NQ), one-minute data from June 2010 to April 2026, it depends on the direction. Fading the 2-standard-deviation band back to VWAP lost money in all 17 calendar years, with an out-of-sample Sharpe of -2.64 after 0.01% round-trip costs. The trend rule, five closes above VWAP to go long and five below to go short, had an out-of-sample Sharpe of 0.48, above our pre-registered failure line of 0.3, but it earned only 1.73 basis points per trade before costs, made most of its money in 2011, 2018 and 2020, and lost in every year from 2023 to 2026.
What is the best VWAP trading strategy?
Of the two textbook forms we tested, trading with VWAP beat trading against it by a wide margin. The trend rule was positive before costs in both halves of the data (Sharpe 1.27 in-sample and 1.16 out of sample before costs), while the band fade lost money on average even before costs. Keeping only the long side of the trend rule, chosen on 2010-2017 data, cut the maximum drawdown from -38.4% to -13.8% with an out-of-sample Sharpe of 0.44. None of these is strong enough to call a finished strategy.
Is there a VWAP strategy PDF?
Yes. EdgeLab's free PDF has both VWAP rules from this test on one page, the results table, and standalone Python code you can run on your own one-minute data, with switches for the rule and its setting. It is sent by email from the signup box in the article.

Robin Eriksson
Founder of EdgeLab. Five years of discretionary losses taught me to test everything — now I publish the strategies that survive. About me →
Related: We asked AI for 10 trading strategies and backtested every one · ICT Silver Bullet strategy: what 16 years of Nasdaq futures say about its win rate · Is the opening range breakout dead? We tested it on the Nasdaq