ICT concepts — the Silver Bullet, fair value gaps, order blocks, turtle soup, candle range theory — are taught to a huge audience, and the question people search for after the videos is always the same: what is the win rate? The answers online are mostly marked-up screenshots, indicator scripts without results, or claims nobody can check. We think the concepts deserve a proper test: not mockery, and not faith.
How we test them
- A written, mechanical definition of each concept, fixed before the test. We say plainly where it is our interpretation, and that a discretionary trader applies these ideas with judgement a rule cannot capture.
- Sixteen years of one-minute Nasdaq futures (and gold futures where the concept applies), June 2010 to April 2026 — not a few hand-picked weeks.
- Costs on every trade, and entries filled where the market really traded. Intraday concepts trade often, so costs decide a lot; every test shows what doubling them does.
- The early years to build, the later years held out. Results by year and by session, published whether the concept works or not.
The first idea in this family we measured is one ICT shares with Linda Raschke: turtle soup, the fade of a failed breakout. In our research log it failed on every market we tried — it is in the list below. A dedicated turtle soup test, with Raschke's original rules and the ICT version side by side, follows.
What failed
-
The Strategy Graveyard: we stress-tested 150+ trading strategies — most didn't survive
Most strategies we screen fail our bar, and most of those aren't dead, just duplicates of edges we already own.
Failed Turtle Soup (Street Smarts): 4 markets tested, 0 passed; walk-forward mean Sharpe between -0.04 and -0.4.
Written down, waiting to be tested
These tests are pre-registered: the rules, the data and what counts as failure were fixed before any backtest ran. Working titles; the result is published either way.
- ICT Silver Bullet: what 16 years of Nasdaq futures say about its win rate
- Fair value gap strategy: the win rate, measured on 16 years of Nasdaq and gold
- Order blocks, defined mechanically: what's the win rate?
- Candle range theory (CRT) tested on Nasdaq futures
See this result on the scoreboard.
By topic: Nasdaq · Gold · ICT concepts · Classic books · All of them: the scoreboard
Download a free strategy
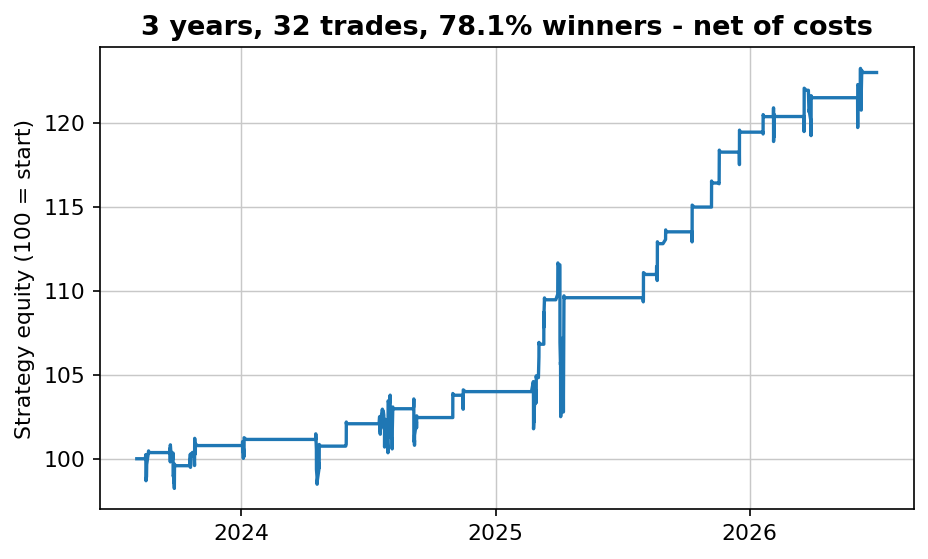
Simple and robust — 70% winners across 155 trades over 16 years, net of costs. The free PDF gives you the market, the timeframe and the exact rules in plain English, plus every single trade it has taken.
Instant delivery. One PDF, no spam. Unsubscribe anytime.
FAQ
What is the ICT Silver Bullet win rate?
Our test of it was written down before it ran: the New York morning window ICT teaches, a fair value gap entry, a mechanical stop and target, on sixteen years of Nasdaq futures, net of costs. Its result goes in the lists on this page, whatever it is, and its article gives the win rate year by year.
Do fair value gaps work?
Nobody knows until they are tested with costs and unseen data. A fair value gap is mechanically definable — a three-candle gap — which makes it one of the easiest ICT concepts to test honestly, so it is one of the first we test, on sixteen years of Nasdaq and gold futures. The result goes in the lists on this page.
Why test ICT concepts at all?
Because many traders use them and few have seen evidence either way. We test the concept, not the person: if a mechanical version has an edge after costs, we publish that; if it does not, we publish that too — with the caveat that a discretionary trader may apply it differently.
Will the ICT tests come with a PDF?
Yes. Each test ships with the exact mechanical rules we used and the Python code, so you can check our interpretation against yours.