The Nasdaq is the market we test most, for a practical reason: it is where our data runs deepest. Daily QQQ goes back to 1999, and one-minute Nasdaq-100 futures (NQ) run from June 2010 to April 2026 — sixteen years of real intraday sessions. That is what makes it possible to test opening-range, overnight and intraday-momentum ideas properly instead of on a few months of a free chart.
Every test on this page follows the same rules. Costs are charged on every trade: 0.05% per side on the ETF, 0.01% per round trip on the futures. Stop and breakout entries are filled where the market really traded, not at the trigger price it gapped through. The most recent years are locked away while a strategy is built and used once, as the out-of-sample test. And every number is generated by the article's own script — including the summaries below, which are rebuilt from each article's results file whenever a new test is published.
What the results say so far: the Nasdaq rewards buying short-term weakness. Dip-buying rules — RSI(2), RSI 30/40, Turnaround Tuesday, buying after three down closes — hold up across decades, timeframes and out-of-sample years. Breakouts traded in both directions mostly fail; the edge that survives is on the long side, with a trend filter. And the famous overnight effect is real, but almost impossible to harvest once you pay for the trades.
What held up
-
Almost all of the Nasdaq's return happens while you sleep. Can you trade it?
Nearly all of the Nasdaq's long-run gain came overnight, but holding every night loses to costs; only a selective version survives.
Works Buy after three down closes, sell the next close: Sharpe 0.73 in-sample, 0.67 out-of-sample, 56.7% winners, max drawdown -18.7%
Failed Hold every night (buy the close, sell the open): Sharpe -0.79 over the full test, max drawdown -98.3%
-
Is the opening range breakout dead? We tested it on the Nasdaq
The naive breakout is noise; trading the direction of the opening move, with a trend filter and a tight stop, held up out-of-sample.
Works Opening-move breakout, long-only with trend filter: Sharpe 0.77 in-sample, 0.84 out-of-sample, 12.4% winners, max drawdown -4.6%
Failed Naive opening range breakout, both directions: Sharpe -0.27 in-sample, 0.32 out-of-sample, 31.0% winners, max drawdown -43.1%
-
Zarattini's intraday momentum on the Nasdaq: the long side survives, the short side is a mirage
The long side of Zarattini's intraday momentum strategy survives on Nasdaq futures; the short side's profit is regime luck.
Works Intraday momentum (Zarattini), long side: Sharpe 0.90 in-sample, 0.68 out-of-sample, 39.4% winners, max drawdown -11.0%
Weak Intraday momentum (Zarattini), both sides: Sharpe 0.43 in-sample, 1.39 out-of-sample, 38.2% winners, max drawdown -12.3%
Failed Intraday momentum (Zarattini), short side: Sharpe -0.21 in-sample, 1.22 out-of-sample, 37.1% winners, max drawdown -16.5%
-
Does Connors' RSI(2) still work? We tested it on the Nasdaq
Connors' RSI(2) dip-buying is alive on daily, 2-hour and 4-hour Nasdaq bars, net of costs. It isn't dead, just crowded.
Works Connors TPS scale-in: Sharpe 0.72 in-sample, 0.78 out-of-sample, max drawdown -11.6%
Works RSI(3) dip-buying with trend filter: Sharpe 0.61 in-sample, 0.72 out-of-sample, max drawdown -13.6%
Works RSI(3) dip-buying with trend filter: Sharpe 0.37 in-sample, 0.63 out-of-sample, max drawdown -14.1%
Works Connors RSI(2) with 200-day filter: Sharpe 0.68 in-sample, 0.56 out-of-sample, max drawdown -13.4%
-
Does the 200-day moving average work? Tested on five assets
A drawdown tool, not a return booster: it helps assets that trend and crash hard, and backfires on gold and bonds.
Works 200-day moving average, hold or cash: Sharpe 0.53 over the full test, max drawdown -58.9%
-
When is a strategy dead? Three statistical tripwires we use
Three pre-committed tripwires that tell you when a strategy is dead, shown on a real RSI(2) record that turned out fine.
Works RSI(2) dip-buyer (tripwire worked example): Sharpe 0.88 in-sample, 0.86 out-of-sample, 69.0% winners, max drawdown -20.5%
-
The RSI 30/40 strategy: buy the Nasdaq at 30, sell at 40 — every trade from 23 years
Buy at RSI(14) 30, sell at 40: a precise, low-exposure dip-buyer whose 2-hour version is the strongest.
Works RSI(2) dip-buying, exit above the prior high: Sharpe 0.52 in-sample, 0.92 out-of-sample, 70.4% winners, max drawdown -18.0%
Works RSI 30/40: 70.3% winners, max drawdown -11.5%
Weak RSI 30/40: Sharpe 0.10 in-sample, 0.62 out-of-sample, 87.5% winners, max drawdown -26.3%
-
Buying the dip in QQQ: 23 years of evidence, net of costs
Nearly every oversold threshold and holding period we tried was profitable: a plateau, not a lucky setting. It earns most of the return with far less exposure, not more return.
Works RSI(2) below 30, exit above the prior high: Sharpe 0.82 over the full test, max drawdown -19.5%
Weak RSI(14) below 30, hold five days: Sharpe 0.45 over the full test, max drawdown -21.2%
-
The Turnaround Tuesday strategy — rules and 23 years of backtest data
Buying the close after a down Monday and selling at the first strong close held up out-of-sample on QQQ and on SPY.
Works Turnaround Tuesday: Sharpe 0.89 in-sample, 1.17 out-of-sample, 75.7% winners, max drawdown -19.5%
-
Why your backtest passes — and your live account doesn't
A strategy tested once on locked-away data, next to a deliberately overfit one that fell apart on it.
Works Two-rule mean reversion (worked example): Sharpe 0.79 in-sample, 1.04 out-of-sample, max drawdown -20.3%
Failed Deliberately overfit: best of 2160 parameter combinations: Sharpe 0.82 in-sample, 0.33 out-of-sample, max drawdown -24.6%
Real but weak, conditional or beaten by buy-and-hold
-
How to backtest a trading strategy in Python — and the four mistakes that inflate every result
A textbook moving-average crossover, once lookahead, costs and honest parameter choice were fixed, lost to simply owning QQQ.
Weak Moving-average crossover, parameters picked in-sample: Sharpe 0.77 in-sample, 0.77 out-of-sample, max drawdown -28.6%
What failed
-
The Strategy Graveyard: we stress-tested 150+ trading strategies — most didn't survive
Most strategies we screen fail our bar, and most of those aren't dead, just duplicates of edges we already own.
Failed Turtle Soup (Street Smarts): 4 markets tested, 0 passed; walk-forward mean Sharpe between -0.04 and -0.4.
Method and risk research on this market
-
SPY vs QQQ vs gold vs bitcoin: the best asset, risk-adjusted
By risk-adjusted return, an equal-weight mix of stocks, the Nasdaq, gold, bonds and bitcoin beat every single asset.
-
Your worst drawdown is still ahead of you: 10,000 Monte Carlo reshuffles
Reshuffling Turnaround Tuesday's trades shows the backtest's worst drawdown was one of the luckiest possible outcomes.
Written down, waiting to be tested
These tests are pre-registered: the rules, the data and what counts as failure were fixed before any backtest ran. Working titles; the result is published either way.
- Linda Raschke's Holy Grail setup, tested on 16 years of Nasdaq and gold
- ICT Silver Bullet: what 16 years of Nasdaq futures say about its win rate
- Can a mechanical Nasdaq strategy pass an Apex or Topstep evaluation?
- Fair value gap strategy: the win rate, measured on 16 years of Nasdaq and gold
- The Williams %R strategy on the Nasdaq: 27 years, net of costs
See all 23 of these results side by side on the scoreboard.
By topic: Nasdaq · Gold · ICT concepts · Classic books · All of them: the scoreboard
Download a free strategy
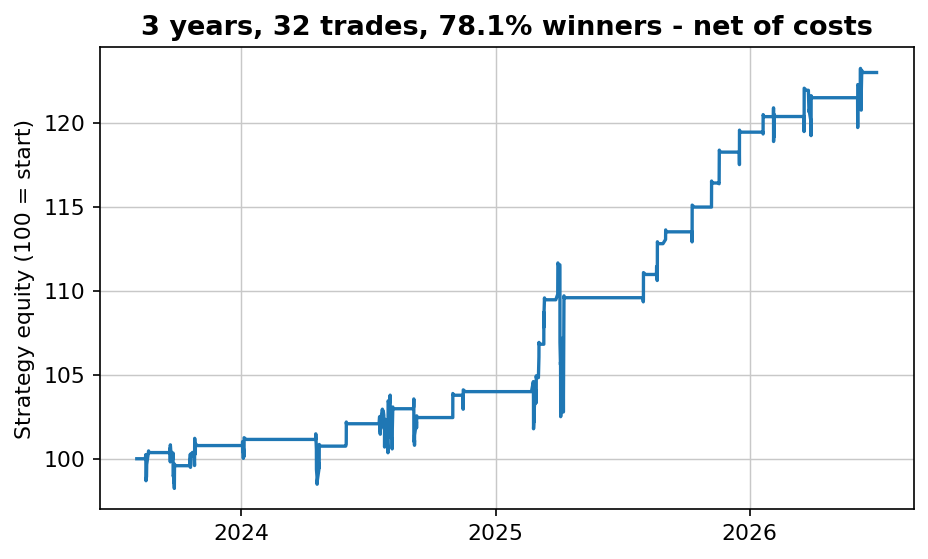
Simple and robust — 70% winners across 155 trades over 16 years, net of costs. The free PDF gives you the market, the timeframe and the exact rules in plain English, plus every single trade it has taken.
Instant delivery. One PDF, no spam. Unsubscribe anytime.
FAQ
What is the best Nasdaq trading strategy you have tested?
By out-of-sample results, short-term dip-buying: Turnaround Tuesday, Connors-style RSI(2) and the RSI 30/40 rules all held up on data they never saw, net of costs. None is a complete system on its own — each is in the market only part of the time — and several are versions of the same trade, so they diversify each other less than it looks. The scoreboard puts them side by side.
Is there a Nasdaq trading strategy PDF?
Yes. The RSI 30/40 strategy is a free PDF with the rules, the backtest and every trade it has taken, and its rules are also open on the RSI page. New strategy tests ship with their own PDF: the exact rules on one page plus Python code you can run on your own data.
Should I test Nasdaq strategies on QQQ or on NQ futures?
Both have a place. QQQ has the longer daily history and is what most people can trade. NQ futures give sixteen years of one-minute data, which intraday rules need, and cost far less per trade. When a strategy is traded on QQQ but tested on NQ, the article says so and shows how closely the two agree.
Does the opening range breakout work on the Nasdaq?
The naive version — trade the first break of the opening range in either direction — failed. Trading only in the direction of the opening move, long-only, above the 200-day average and with a tight stop held up out-of-sample, though it has been weaker in the last two years of the test. The full test has both.
Can you trade the Nasdaq overnight effect?
Not by holding every night: the average night earns about what a round trip costs, so the naive version loses heavily at our standard costs. A selective version — buy the close only after three down days, sell the next close — survived out-of-sample, and its rules are written out in full.