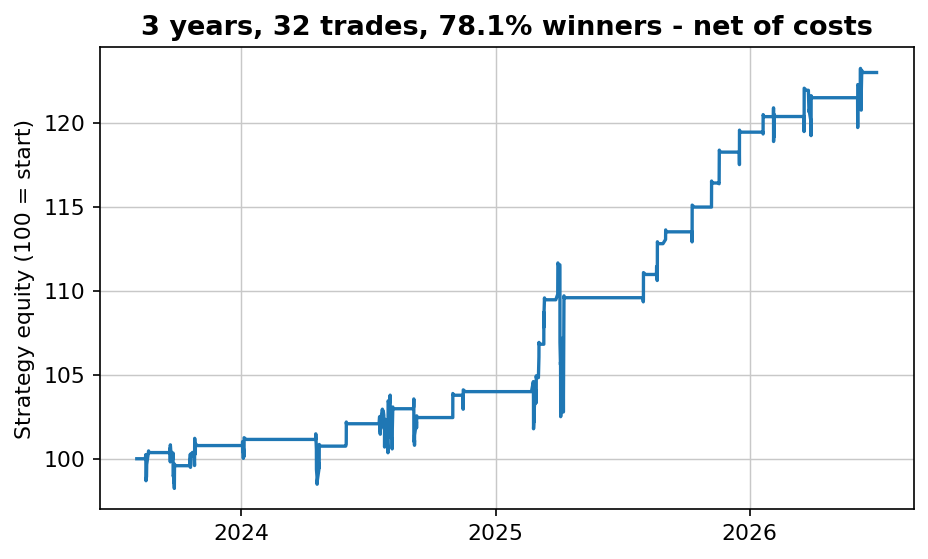
| Turnaround Tuesday | S&P 500 (SPY) | Daily | 0.61 | 1.23 | — | 74.1% | -23.8% | — | Works |
| Turnaround Tuesday | Nasdaq-100 (QQQ) | Daily | 0.89 | 1.17 | — | 75.7% | -19.5% | — | Works |
| 200-day moving average, hold or cashBuy-and-hold: Sharpe 1.08, max drawdown -83.4%. | Bitcoin | Daily | — | — | 1.16 | — | -70.0% | — | Works |
| Two-rule mean reversion (worked example) | Nasdaq-100 (QQQ) | Daily | 0.79 | 1.04 | — | — | -20.3% | — | Works |
| RSI(2) dip-buying, exit above the prior high | Nasdaq-100 (QQQ) | Daily | 0.52 | 0.92 | 0.73 | 70.4% | -18.0% | — | Works |
| RSI(2) dip-buyer (tripwire worked example) | Nasdaq-100 (QQQ) | Daily | 0.88 | 0.86 | 0.87 | 69.0% | -20.5% | — | Works |
| Opening-move breakout, long-only with trend filterWeaker in the last two years of the test. | Nasdaq-100 futures (NQ) | 5-min opening range, intraday | 0.77 | 0.84 | 0.80 | 12.4% | -4.6% | — | Works |
| RSI(2) below 30, exit above the prior highIn the market 37% of the time. | Nasdaq-100 (QQQ) | Daily | — | — | 0.82 | — | -19.5% | — | Works |
| Connors TPS scale-in | Nasdaq-100 futures (NQ) | Daily | 0.72 | 0.78 | — | — | -11.6% | — | Works |
| 200-day moving average, hold or cashBuy-and-hold: Sharpe 0.64, max drawdown -55.2%. | S&P 500 (SPY) | Daily | — | — | 0.72 | — | -29.4% | — | Works |
| RSI(3) dip-buying with trend filter | Nasdaq-100 futures (NQ) | 4-hour | 0.61 | 0.72 | — | — | -13.6% | — | Works |
| Intraday momentum (Zarattini), long side | Nasdaq-100 futures (NQ) | Intraday | 0.90 | 0.68 | 0.76 | 39.4% | -11.0% | — | Works |
| Buy after three down closes, sell the next close | Nasdaq-100 (QQQ) | Daily | 0.73 | 0.67 | 0.67 | 56.7% | -18.7% | 45 bp per trade before costs, 35 bp after | Works |
| RSI(3) dip-buying with trend filter | Nasdaq-100 futures (NQ) | 2-hour | 0.37 | 0.63 | — | — | -14.1% | — | Works |
| Connors RSI(2) with 200-day filter | Nasdaq-100 futures (NQ) | Daily | 0.68 | 0.56 | — | — | -13.4% | — | Works |
| 200-day moving average, hold or cashBuy-and-hold: Sharpe 0.46, max drawdown -83.0%. | Nasdaq-100 (QQQ) | Daily | — | — | 0.53 | — | -58.9% | — | Works |
| RSI 30/40155 trades. The article reports win rate and drawdown for this version, not Sharpe. | Nasdaq-100 (QQQ; NQ futures as the history proxy) | 2-hour | — | — | — | 70.3% | -11.5% | — | Works |
| Intraday momentum (Zarattini), both sidesThe headline number rides the short side's out-of-sample luck. | Nasdaq-100 futures (NQ) | Intraday | 0.43 | 1.39 | 0.99 | 38.2% | -12.3% | — | Weak |
| Moving-average crossover, parameters picked in-sampleBuy-and-hold over the out-of-sample years: Sharpe 0.93. | Nasdaq-100 (QQQ) | Daily | 0.77 | 0.77 | — | — | -28.6% | — | Weak |
| Momentum rotation: hold the six-month winnerEqual-weight buy-and-hold of the same three: Sharpe 0.96. | Stocks, bonds, gold (SPY / TLT / GLD) | Monthly | 0.52 | 0.70 | 0.61 | — | -33.6% | — | Weak |
| RSI 30/40Only 32 trades in the whole test: precise, but too rare to lean on alone. | Nasdaq-100 (QQQ) | Daily | 0.10 | 0.62 | 0.37 | 87.5% | -26.3% | — | Weak |
| RSI(14) below 30, hold five daysIn the market 3.3% of the time. | Nasdaq-100 (QQQ) | Daily | — | — | 0.45 | — | -21.2% | — | Weak |
| Fridays when VIX is above 20 | Gold (GLD) | Daily, Thursday close to Friday close | — | — | 0.23 | 51.3% | -22.0% | Sharpe 0.23 at 0.1% per round trip, 0.43 at futures-level costs | Weak |
| Intraday momentum (Zarattini), short sideNegative in-sample; profitable only out-of-sample. | Nasdaq-100 futures (NQ) | Intraday | -0.21 | 1.22 | 0.64 | 37.1% | -16.5% | — | Failed |
| 200-day moving average, hold or cashBuy-and-hold: Sharpe 0.67, max drawdown -45.6%. | Gold (GLD) | Daily | — | — | 0.58 | — | -35.1% | — | Failed |
| Sell in May, bonds for the summerBuy-and-hold over the same years: Sharpe 0.66. | S&P 500 (SPY) and bonds | Seasonal, two switches a year | — | — | 0.57 | — | -39.6% | — | Failed |
| Sell in May, cash for the summerBuy-and-hold: Sharpe 0.64. | S&P 500 (SPY) | Seasonal, two switches a year | — | — | 0.55 | — | -36.7% | — | Failed |
| Deliberately overfit: best of 2160 parameter combinations | Nasdaq-100 (QQQ) | Daily | 0.82 | 0.33 | — | — | -24.6% | — | Failed |
| Naive opening range breakout, both directions | Nasdaq-100 futures (NQ) | 5-min opening range, intraday | -0.27 | 0.32 | 0.11 | 31.0% | -43.1% | — | Failed |
| Every Friday (Thursday close to Friday close)The average Friday edge is about one round-trip commission. | Gold (GLD) | Daily | — | — | 0.05 | 50.8% | -40.3% | — | Failed |
| 200-day moving average, hold or cashBuy-and-hold: Sharpe 0.29, max drawdown -48.4%. | Long bonds (TLT) | Daily | — | — | 0.03 | — | -47.3% | — | Failed |
| Fridays above the 200-day average | Gold (GLD) | Daily | — | — | -0.02 | 49.7% | -32.5% | — | Failed |
| Santa Claus rally | S&P 500 (SPY) | Seasonal | 0.31 | -0.07 | — | — | — | — | Failed |
| Hold every night (buy the close, sell the open)The overnight effect is real; trading it every night is not. | Nasdaq-100 (QQQ) | Daily, overnight hold | — | — | -0.79 | — | -98.3% | Breaks even only below 2.8 bp per side | Failed |
| Classic book setups (Street Smarts, DeMark, Kaufman, Chande)17 variants tested, 0 passed the bar. | Futures | Various | — | — | — | — | — | — | Failed |
| Published catalog setups (DAX drift, EuroStoxx, natural gas, soybeans)4 tested, 0 passed: all negative out-of-sample. | European index and commodity futures | Daily and seasonal | — | — | — | — | — | — | Failed |
| Trend following, Carver-style acceleration20 variants tested, 0 passed. | Futures panel | Daily | — | — | — | — | — | — | Failed |
| Trend following, Clenow-style core panel24 variants tested, 0 passed: real, but needs far more markets than a retail account holds. | Futures panel | Daily | — | — | — | — | — | — | Failed |
| Turtle Soup (Street Smarts)4 markets tested, 0 passed; walk-forward mean Sharpe between -0.04 and -0.4. | S&P 500, Nasdaq, gold and bond futures | Daily | — | — | — | — | — | — | Failed |