Costs don't care how long you hold a trade
A trade held for weeks captures a move measured in percent. A trade held for minutes captures a move measured in hundredths of a percent — and pays the same commission, the same spread and the same slippage. That is the whole reason fast strategies are fragile: as the holding period shrinks, the edge per trade shrinks with it, the cost per trade doesn't, and there are more trades to pay it on.
Our overnight study is the cleanest example we have. The average QQQ night earned 5.5 basis points — a real edge, measured over 27 years. Owning it every night means 251.5 round trips a year, and at our standard 0.05% per side a round trip costs 10 basis points. Load the "Every night in QQQ" example above: the break-even comes out at 2.8 basis points per side, the same number as in the article, which is how a real edge turned into −96.5%.
The opposite case is in our Python backtesting tutorial. A moving-average crossover changed position about eight times a year, and the same 0.05% charge barely moved it: +659% before costs, +591% after. Cost sensitivity isn't a property of the cost you assume; it is a property of the strategy.
How the numbers are calculated
- Round-trip cost. Percent mode: twice the cost per side. Futures: commission and fees plus slippage on both sides, commission + 2 × ticks × tick value.
- Net average trade = average trade before costs − round-trip cost.
- Costs per year = round trips per year × round-trip cost × position size (contracts in futures mode). This is the simple sum; percent mode also shows the compounded figure, which is a little lower because each cost is paid on a balance earlier costs have already shrunk.
- Break-even cost = the average trade before costs, per round trip, or half of it per side. In futures mode it is also shown in ticks.
- Headroom = average trade before costs ÷ round-trip cost: how many times your costs can multiply before the edge is gone. Below 2× is fragile — one bad fill regime and it is gone.
- The chart keeps your gross yearly edge (trades × average trade) fixed and spreads it over more trades. That is generous to fast trading — in real markets a faster strategy rarely earns more per year before costs — and it still shows where the costs take everything.
What cost should you assume?
More than you think you pay. Every EdgeLab backtest on stocks and ETFs charges 0.05% per side — two to three times what a liquid ETF trade really costs a retail trader — and the intraday futures tests (the opening range breakout and intraday momentum) charge 0.01% per round trip on Nasdaq futures and say what double costs do. The method is written up in how we test. Slippage usually matters more than commission: market orders at the open and the close, and stop orders in a fast market, fill worse than the screen suggests. A strategy worth trading survives the 2× row in the table above, and ideally the 4× row.
Download a free strategy
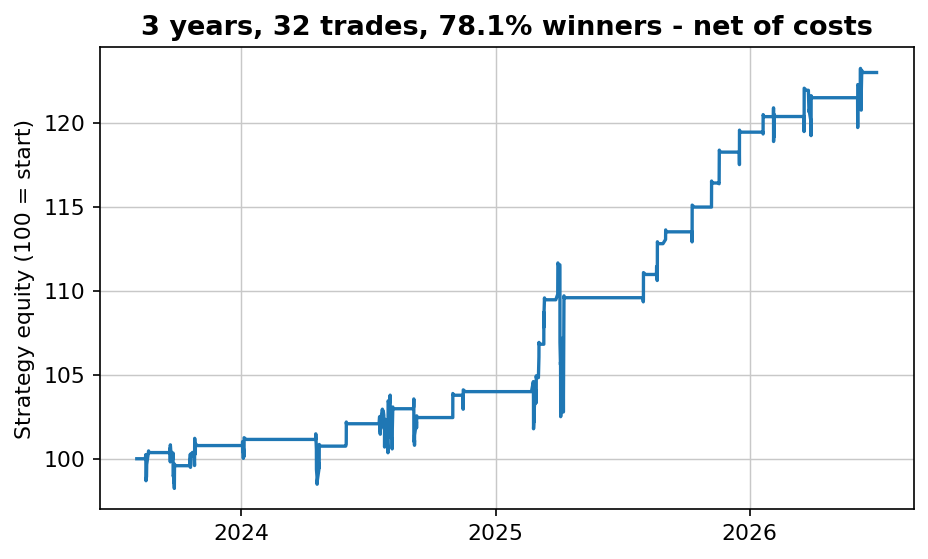
Looking for a strategy that doesn't live or die by its costs? This one trades about ten times a year, and every number is net of costs — 70% winners across 155 trades over 16 years. The free PDF gives you the market, the timeframe and the exact rules in plain English, plus every single trade it has taken.
Instant delivery. One PDF, no spam. Unsubscribe anytime.
FAQ
How much do trading costs cost per year?
Round trips per year times the cost of one round trip, times the share of the account each trade uses. One trade a day at 0.05% per side is 0.10% per round trip × 252 days ≈ 25% of the account a year — before the strategy has earned anything. A strategy that trades eight times a year pays 0.8%.
What is a break-even trading cost?
The cost per trade at which the strategy earns exactly nothing. It equals the average trade before costs: if the average trade earns 0.20% gross, a round trip may cost up to 0.20%, or 0.10% per side. Divide the break-even by what you really pay to see how many times your costs can rise before the edge is gone.
Why do intraday strategies fail because of costs?
A trade's cost doesn't depend on how long you hold it, but its profit does. A trade held for minutes captures a move measured in hundredths of a percent and pays the same commission, spread and slippage as a trade held for weeks. The faster the strategy, the larger the share of each trade that goes to costs — and the more trades there are to pay it on.
What trading cost should I use in a backtest?
More than you think you pay. EdgeLab charges 0.05% per side on stocks and ETFs — two to three times what a liquid ETF trade really costs — and 0.01% per round trip on Nasdaq futures in intraday tests, with the results shown at double costs too. Include slippage as well as commission, and check that the strategy survives 2× and ideally 4× your estimate.
Does compounding change the yearly cost?
Slightly. The simple yearly cost is trades × cost. Compounded, each cost is paid on a balance that earlier costs have already shrunk: 252 round trips at 0.10% take 22.3% of the account rather than 25.2%. The calculator shows both in percent mode.